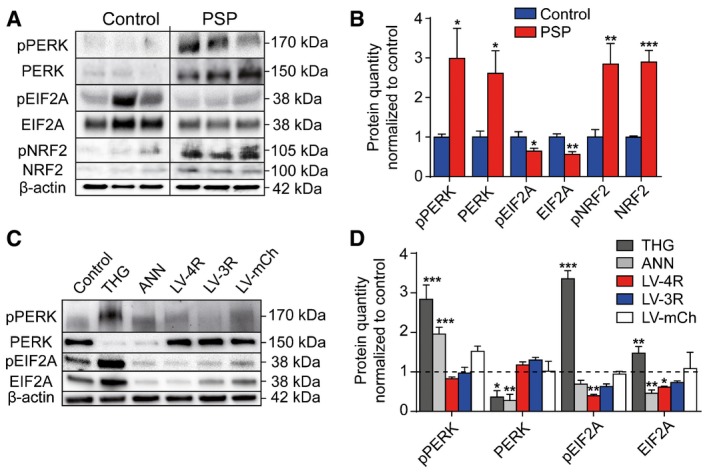
Representative Western blots of gyrus frontalis superior homogenates of controls without neurodegenerative disorder and PSP patients.
Densitometric analysis of Western blots described in (A) (controls, n = 6; PSP, n = 7).
Representative Western blots of protein extracts from LUHMES neurons after 48‐h treatment with thapsigargin (THG, 30 nM), an inducer of ER stress (positive control), or annonacin (ANN, 25 nM), or after lentivirus‐induced overexpression of 4R tau (LV‐4R) or 3R tau (LV‐3R).
Densitometric analysis of Western blots described in (C).
Data information: Results were normalized to untreated control neurons set as 1 (dashed line). Data are mean + SEM (
n =
3 per condition). Statistical analysis in (B) was Student's
t‐tests and in (D) one‐way ANOVA with Dunnett's
post hoc test. *
P <
0.05, **
P <
0.01, ***
P <
0.001 versus control.

