
Figure EV3. Effect of glucose starvation on 4E‐BP1 phosphorylation in KO cells.
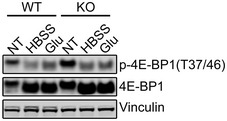
Immunoblot analysis of WT and KO cell lysates after HBSS (2 h) or glucose (Glu) starvation (2 h) with anti‐4E‐BP1 antibodies. The degree of 4E‐BP1 dephosphorylation in WT and KO is different after HBSS treatment, but similar after Glu starvation.Source data are available online for this figure.