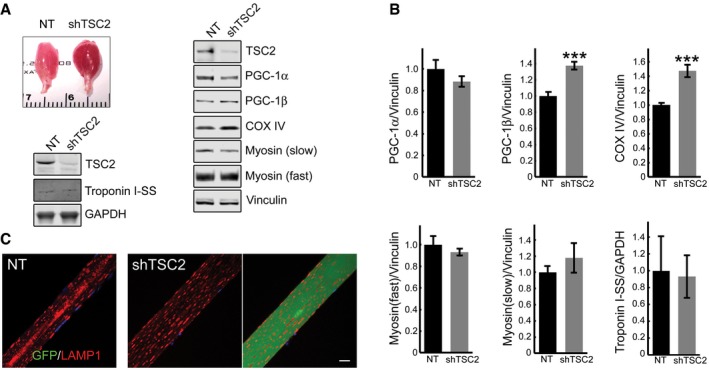
Figure EV4. Characterization of the AAV1‐shRNA‐TSC2‐infected muscle in GAA‐KO mice.

-
A, BAppearance of the infected muscle (reddish color). Immunoblot analysis of sham‐infected (NT) and infected (shTSC2) muscle with the indicated antibodies; an increase in the levels of PGC‐1β (n = 7) and COX IV (n = 7) is seen in the infected muscle. Graphical representation of the data from Western blots. Data are mean ± SE; Student's t‐test; ***P < 0.001. The difference in the levels of PGC‐1α (n = 7), myosin fast, myosin slow, and troponin (n = 4 each) between non‐infected and infected muscle is not significant.
-
CImmunostaining of sham‐infected (left panel) and infected (two right panels) fibers with LAMP1 (red); no major difference in the distribution of lysosomes is observed between the infected and sham‐infected fibers; the difference is in the absence of the autophagic area and the size of the infected fiber. Scale bar: 20 μm.
Source data are available online for this figure.
