
Figure 5. KO cells exhibit a diminished response to starvation and inadequate activation after refeeding.
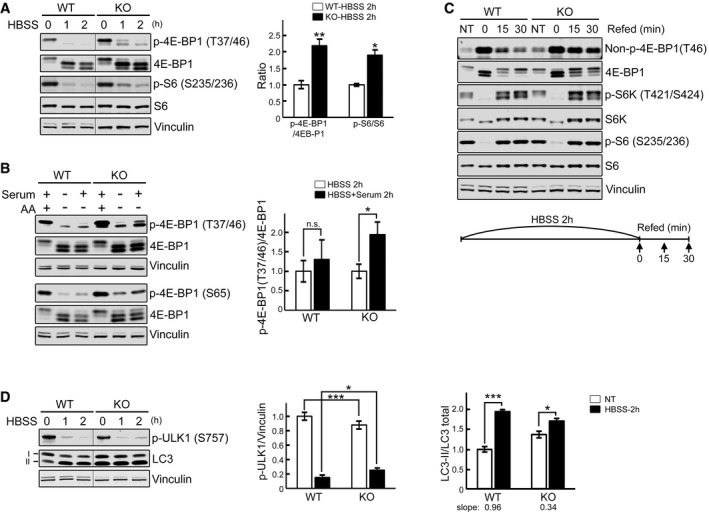
- WT and KO myotubes were starved (HBSS) for 0, 1, and 2 h, lysed and subjected to immunoblot analysis with the indicated antibodies. The levels of p‐4E‐BP1T37/46 and p‐S6S235/236 in KO are higher compared to WT at 1 and 2 h of starvation. Graph shows an increase in p‐4E‐BP1T37/46/total (n = 5) and p‐S6S235/236/total (n = 3) ratios in KO compared to WT after 2 h starvation; the data represent mean ± SE. *P < 0.05, **P < 0.01, Student's t‐test. Vinculin was used as a loading control. The blots are composite images; the samples were run on the same gel.
- WT and KO myotubes were incubated in HBSS with or without dialyzed serum for 2 h, lysed, and subjected to immunoblot analysis with the indicated antibodies. Both p‐4E‐BP1T37/46 and p‐4E‐BP1S65 antibodies were used for the experiments. The degree of 4E‐BP1 dephosphorylation after amino acid starvation (AA) is different from that after HBSS in KO (*P < 0.05) but not in WT cells (n.s., not significant). Graph represents mean ± SE; Student's t‐test. n = 3 for each condition.
- WT and KO myotubes were starved (HBSS) for 2 h, and then refed for 15 and 30 min using differentiation medium as shown schematically. Cell lysates were then subjected to immunoblot analysis with the indicated antibodies. Significant amounts of non‐phosphorylated and hypophosphorylated forms of 4E‐BP1 are still seen after 15 and 30 min of refeeding in KO cells; the levels of S6K and S6 in the KO were not different from those in controls following refeeding.
- WT and KO myotubes were starved as in (A). The level of p‐ULK1S757 in KO is higher than in WT after 2 h starvation. The p‐ULK1/vinculin (n = 4) and LC3‐II/total (LC3‐I + LC3‐II; n = 3) ratios at 2 h after starvation were calculated. Data are mean ± SE; *P < 0.05, ***P < 0.001, Student's t‐test. The blots are composite images; the samples were run on the same gel.
Source data are available online for this figure.