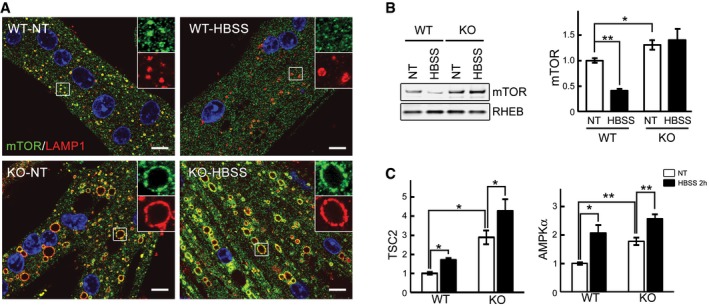
Figure 6. mTOR remains at the lysosome in fully fed and starved KO cells.

- Immunostaining of WT and KO myotubes with anti‐LAMP1 (red) and anti‐mTOR (green) antibodies. Lysosomal localization of mTOR is observed in both WT and KO cells grown in differentiation medium (NT, not treated; fed). Mostly cytosolic localization of mTOR (away from lysosomes) is observed in WT cells after 2 h of starvation (HBSS), whereas the two stains still co‐localize in KO cells. Scale bar: 10 μm.
- WT and KO myotubes were lysed and subjected to fractionation to obtain lysosome‐enriched fractions. The isolated fractions from fed (NT) and starved (HBSS; 2 h) cells were then examined by Western blot showing increased levels of mTOR in KO cells. RHEB was used as a loading control. Graphs represent mean ± SE; *P < 0.05, **P < 0.01, Student's t‐test. n = 4 for each condition.
- WT and KO myotubes were treated as in (B). Graphs show relative amounts of TSC2 and AMPKα in the lysosomal fraction from WT and KO cells in nutrient‐rich condition (NT; open bars) and after 2 h of starvation (HBSS; black bars). Data are mean ± SE; *P < 0.05, **P < 0.01, Student's t‐test. n = 3 for WT; n = 4 for KO.
Source data are available online for this figure.
