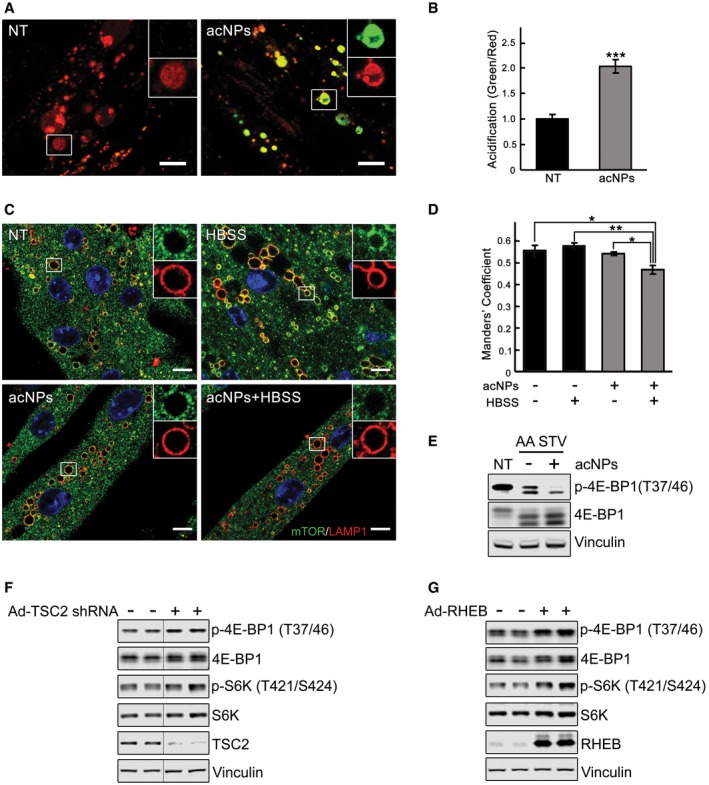
Effect of lysosomal acidification (A–E) and effect of the manipulation of the TSC2/RHEB pathway (F, G).
-
A, B
KO myotubes were incubated in the presence (acNPs; 50 μg/ml) or in the absence of acNPs (NT) for 18 h and exposed to UV‐light for 5 min; following 2 h of incubation in differentiation medium, the cells were loaded with LysoTracker Red and LysoSensor Green (30 min), washed, and visualized by confocal microscopy. Both dyes target lysosomes, but only LysoSensor Green becomes more fluorescent in acidic environments. The acNPs‐treated KO cells exhibit a much higher green fluorescence intensity than do untreated cells. Scale bar: 10 μm. The ratios of green/red fluorescence intensities (shown in B) were evaluated using ImageJ software; n = 16 myotubes for KO control; n = 20 myotubes for acNPs‐treated KO. Data are mean ± SE; ***P < 0.001, Student's t‐test.
-
C, D
KO myotubes were incubated in the presence (acNPs) or in the absence of acNPs (NT) for 18 h, exposed to UV‐light for 5 min, and incubated for an additional 1 h in differentiation medium; the cells were then starved for 2 h (HBSS), followed by fixation and immunostaining with LAMP1 (red) and mTOR (green). The degree of co‐localization of the two stains (evaluated using ImageJ software; shown in D) is reduced in acNPs‐treated cells following starvation. Scale bar: 10 μm. At least five myotubes were analyzed for each condition. Data are mean ± SE; *P < 0.05, **P < 0.01, Student's t‐test.
-
E
acNPs‐treated and non‐treated KO myotubes were incubated in HBSS with dialyzed serum for 2 h, lysed and subjected to immunoblot analysis with the indicated antibodies; the degree of dephosphorylation of 4E‐BP1 is more prominent in acNPs‐treated cells. Vinculin was used as a loading control.
-
F, G
Immunoblot analysis showing the effects of TSC2 inhibition (F) and RHEB overexpression (G) on mTOR activity in KO myotubes. Increased phosphorylation of the two major downstream mTOR targets, 4E‐BP1 and S6K, is observed following the treatments. Vinculin was used as a loading control. Blots in (F) are composite images; the samples were run on the same gel.

