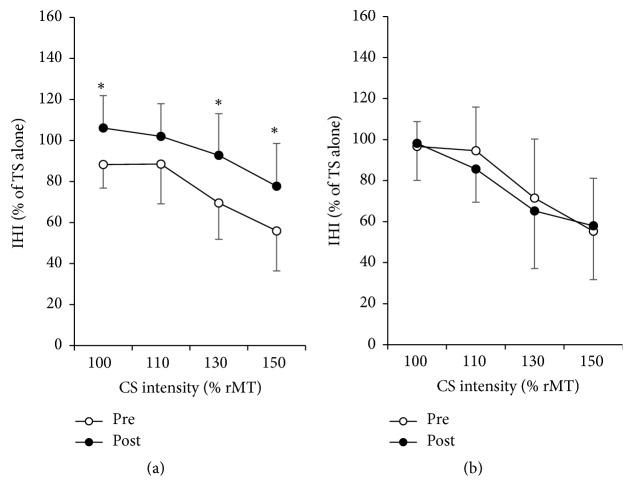
Figure 2.
Interhemispheric inhibition (IHI) curves. IHI curves (N = 10) show inhibition effect from the M1 in the right hemisphere (where the conditioning stimulus (CS) was delivered) to the M1 in the left hemisphere (where the testing stimulus (TS) was delivered). The abscissa indicates the CS intensities expressed as a fraction of rMT. The ordinate indicates the amplitude of conditioned MEP from the left M1 expressed as a percentage of the MEPs from TS alone. Higher values represent lower inhibition from the right M1 to the left M1. Preintervention (○); postintervention (●). After the intervention, significantly lower inhibitions from CS to TS were observed from the treatment of acupuncture (a) but not the control (b). ∗P < 0.0125 (Bonferroni's post hoc adjustment).

