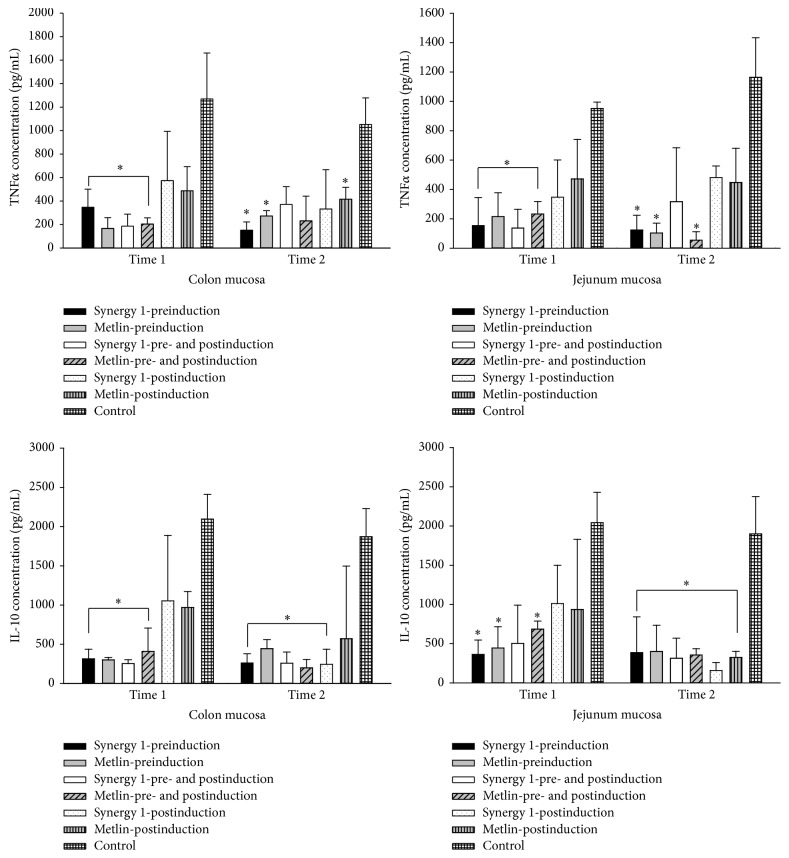
Figure 2.
TNFα and IL-10 concentration in intestinal samples. Values are presented as means ± SE using 5 data of TNFα and IL-10 concentration. ∗Values indicate significant differences (p < 0.05) between groups treated with fructans versus cancer-induced group. Time 1, seven months. Time 2, nine months.

