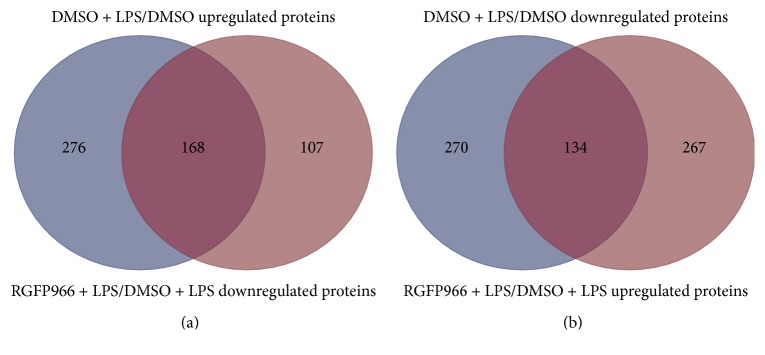
Figure 2.
Venn diagrams of the differentially expressed proteins between LPS-stimulated (DMSO + LPS/DMSO) and RGFP966-treated (RGFP966 + LPS/DMSO + LPS) microglia cells. (a) 168 proteins were upregulated by LPS and reversed with the treatment of RGFP966. (b) 134 proteins were downregulated after the stimulation of LPS and rescued by RGFP966.

