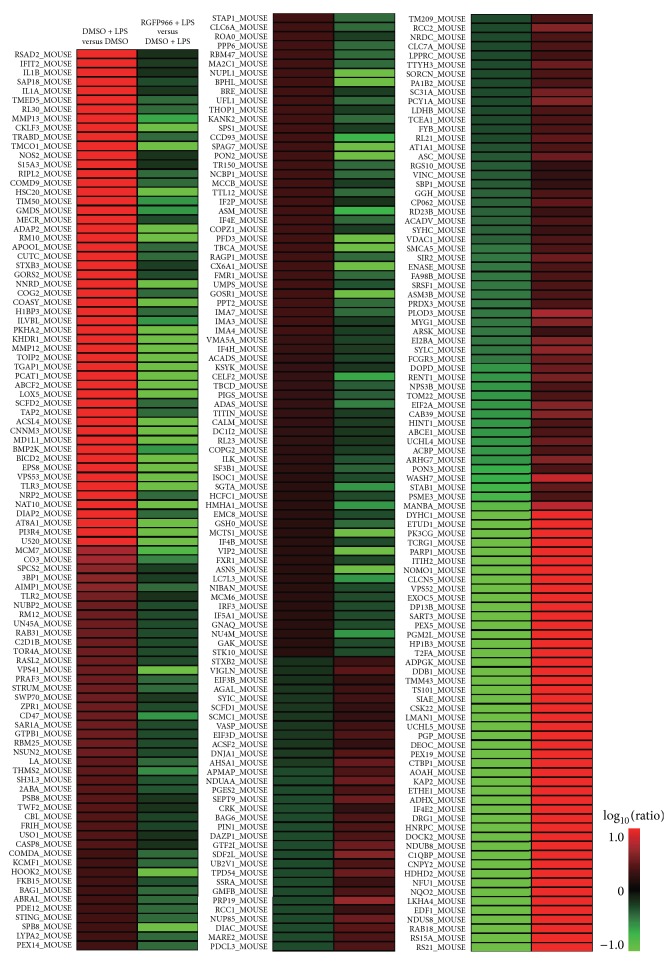
Figure 3.
Heat map generated by MeV regarding proteins subjected to RGFP966 and LPS regulation. Experimental groups were presented on the horizontal axis and proteins were on the vertical axis. Colors were consistent with protein expression levels: red indicated upregulated ratio and green indicated downregulated ratio.

