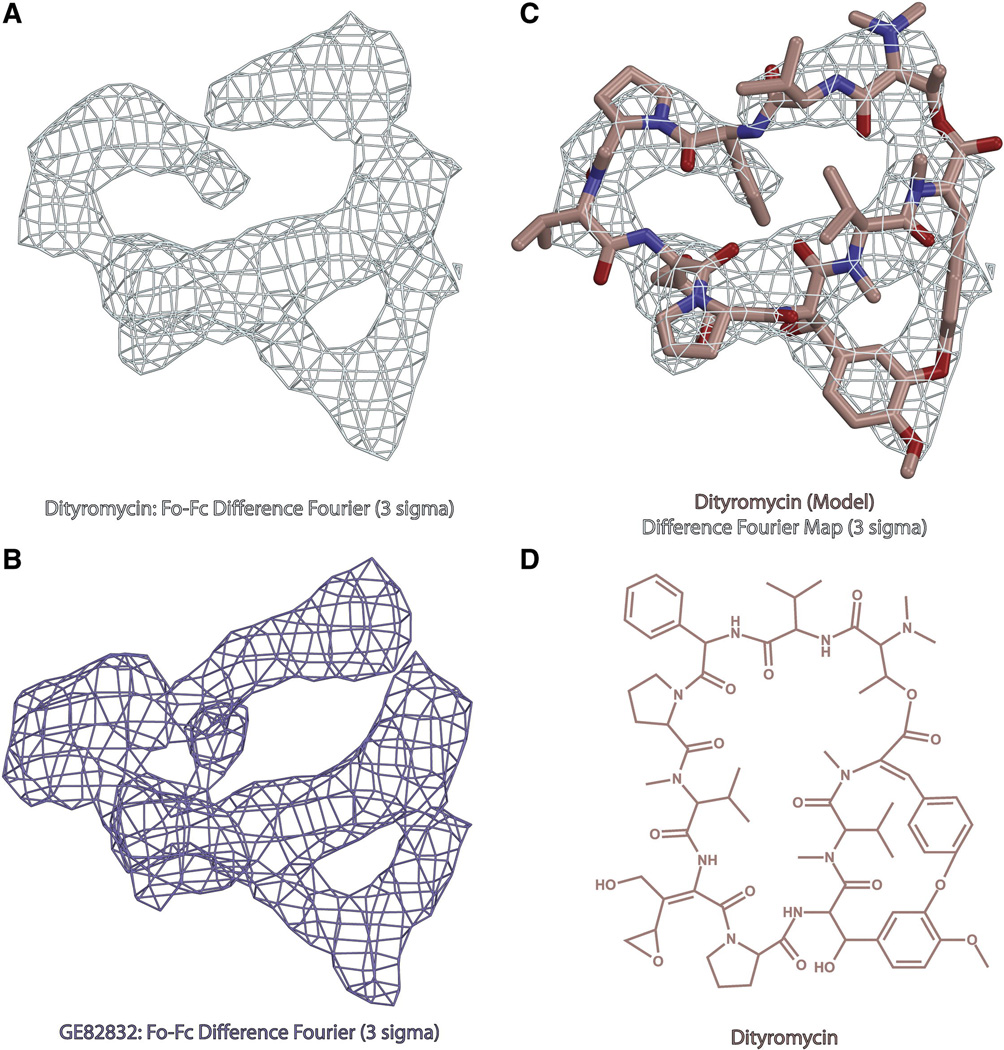
Fig. 1. Structure of dityromycin and comparison with GE82832.
(A) Minimally biased Fo-Fc difference Fourier electron density map contoured at 3σ for dityromycin in complex with the bacterial ribosome from T.thermophilus. (B) Minimally biased Fo-Fc difference Fourier electron density map contoured at 3σ for GE82832 in complex with the bacterial ribosome from T.thermophilus. (C) Model of dityromycin (tan with oxygen colored red and nitrogen blue) docked into the same difference Fourier map shown in panel A. (D) Chemical structure of dityromycin, a secondary metabolite produced by Streptomyces strain AM-2504 (13,14). GE82832 is a secondary metabolite produced by Streptosporangium cinnabarinum (strain GE82832) whose structure is nearly identical to that of dityromycin but for a 2 dalton mass difference likely resulting from an additional point of unsaturation.

