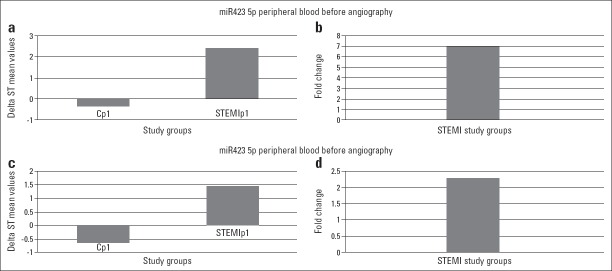
Figure 2.
Fold changes of miR-30d and miR-423-5p, the only miRNAs that had >2-fold increase among 14 miRNAs tested. Statistically, both changes were significant for initial samples, and P values were P=0.034 and P=0.017 for miR-30d and miR-423-5p, respectively. Cp1-control patients’ peripheral blood sample, STEMIp1-STEMI peripheral blood sample. Panels a and c show delta ST value differences between control and STEMI patients for miR-423-5p and miR-30d, respectively. Panels b and d show fold changes

