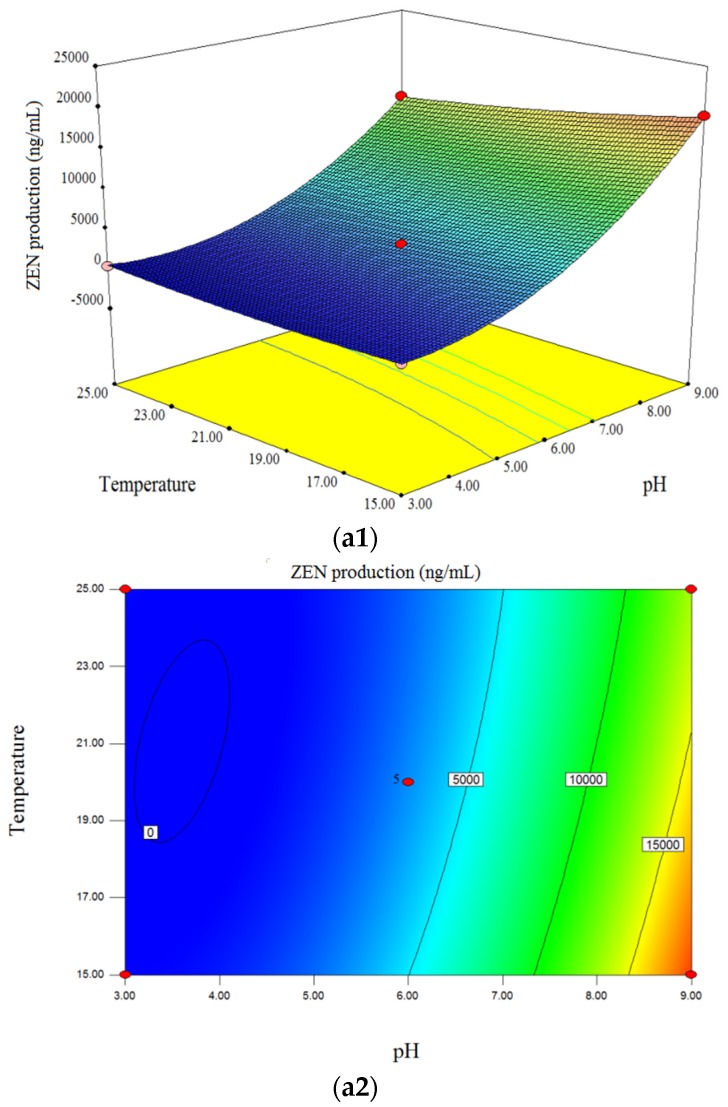
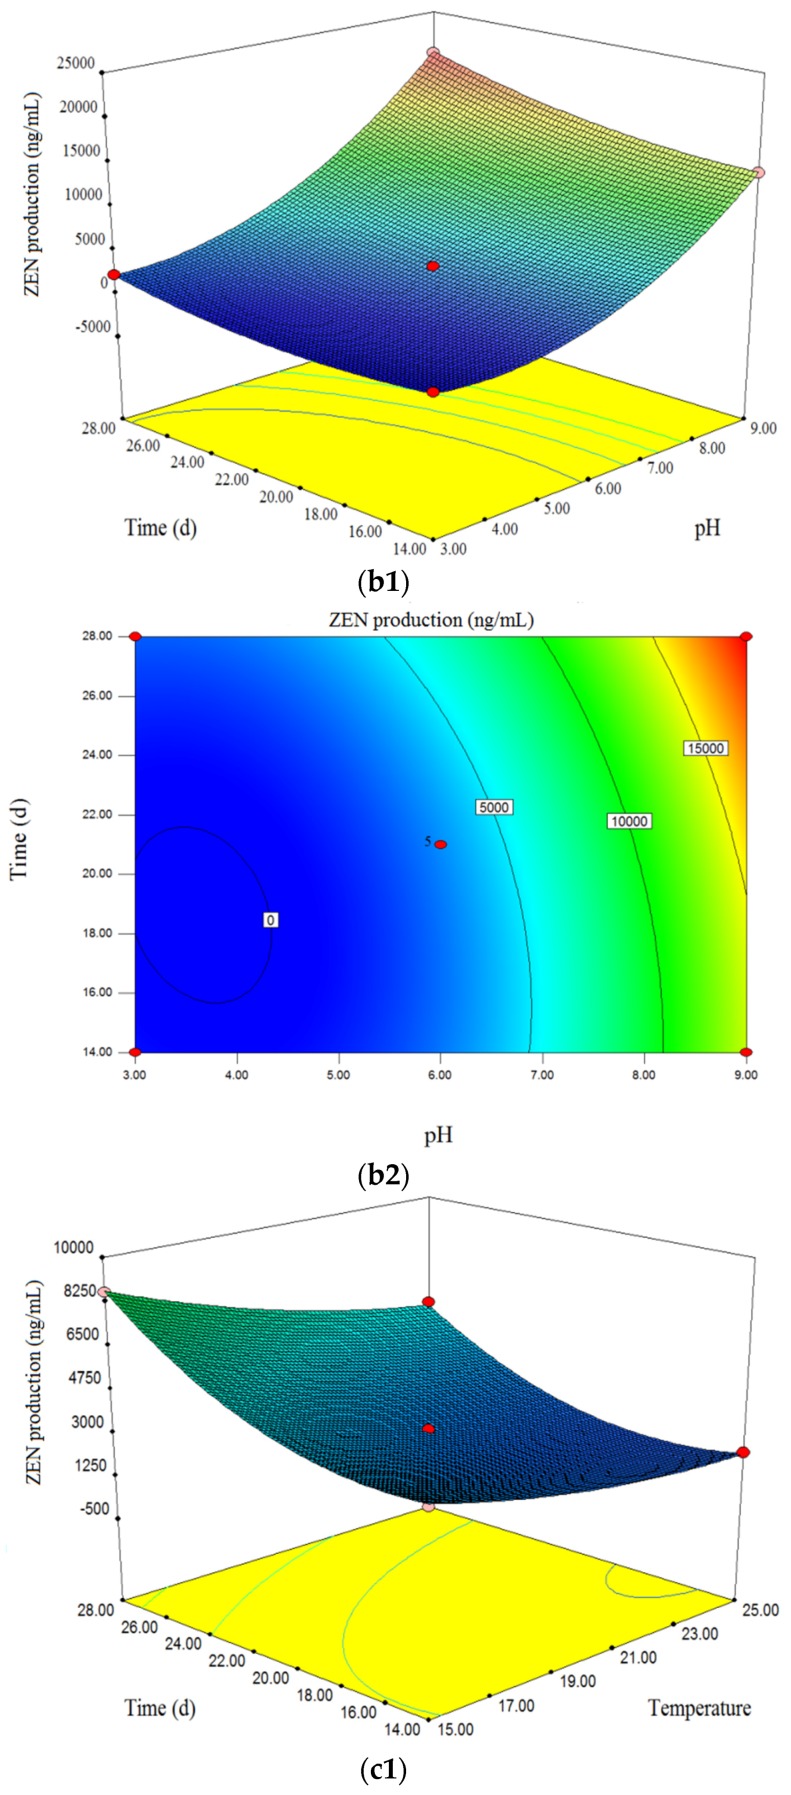
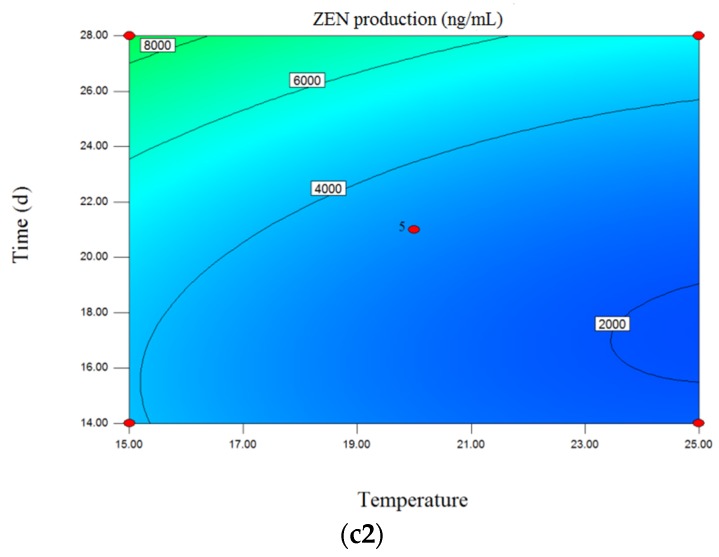
Figure 2.
Three-dimensional response surface plots and corresponding contour plots of variables for ZEN production of F.graminearum strain 29. The interactions between medium pH and incubation temperature (a1,a2), pH and incubation time (b1,b2), and incubation temperature and time (c1,c2) are shown.


