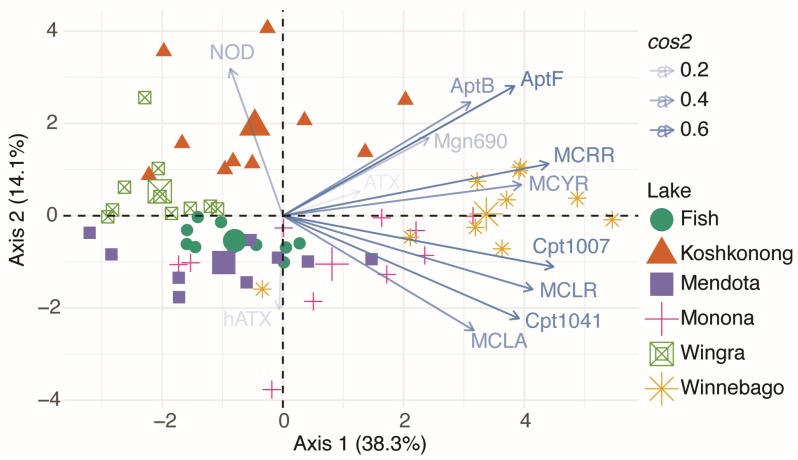
Figure 5.
Principal component analysis (PCA) of lake metabolite profiles observed in this study. Each point represents all metabolites measured in a particular sample. Samples are separated by Euclidean distance where the closer samples are to each other, the more similar their metabolite profiles are. Lakes were significantly different based on analysis of similarity (ANOSIM; p < 0.05; R = 0.55). R values represent how similar samples are. For example, an R value of 1 represents samples that are completely unique, whereas an R value of 0 represent samples that are identical. Arrows point in the direction of samples with higher correlations and the length of each arrow represents the magnitude of that correlation squared (cos2). For example, cyanopeptolin 1007 (Cpt1007) had the strongest influence on samples collected from Lake Winnebago. The largest symbol in each group represents the centroid of all samples from that lake.

