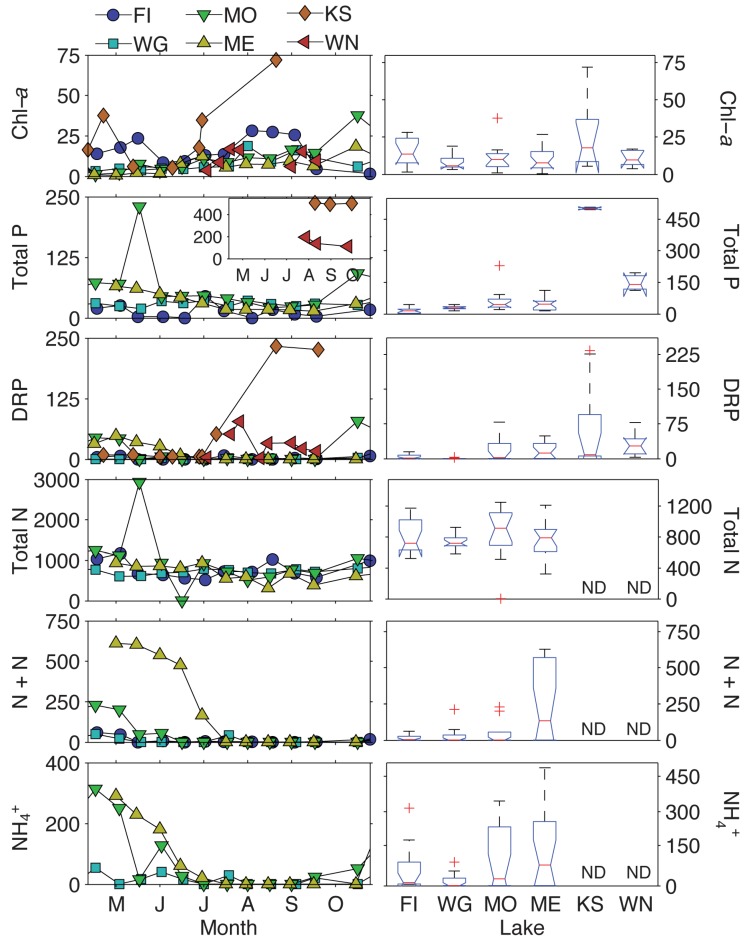
Figure 6.
(Left) Temporal trends in chlorophyll-a and nutrient concentrations observed in this study. (Right) Kruskal–Wallis box and whisker plot results of chlorophyll-a and nutrient concentrations between lakes. The central line represents the median. The top and bottom of the box represents the 25th and 75th quartiles, respectively. The whiskers extend to data points that are not considered outliers, which is ±2.7 standard deviation from the mean, and plus symbols are outliers. Notches that do not overlap represent significant differences in metabolite distributions. Note that for Lake Koshkonong and Lake Winnebago, n = 3 for total phosphorus. Chl-a = chlorophyll-a; total N = total nitrogen; total P = total phosphorus; N + N = nitrate + nitrite; DRP = dissolved reactive phosphorus; NH4+ = ammonium. FI = Fish Lake; WG = Lake Wingra; MO = Lake Monona; ME = Lake Mendota; KS = Lake Koshkonong; WN = Lake Winnebago; ND = no data.

