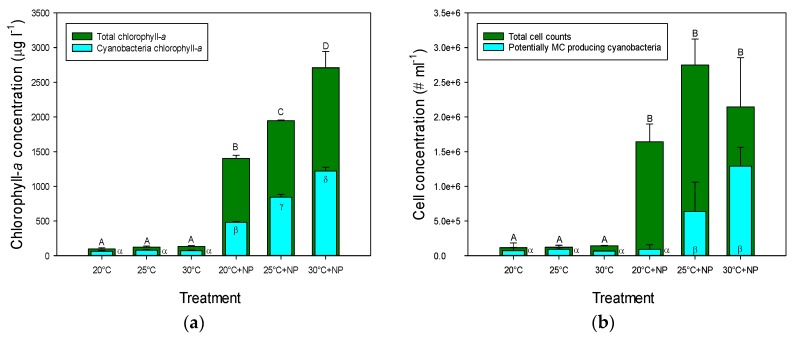
Figure 1.
(a) Cyanobacterial- and total chlorophyll-a concentrations (μg·L−1) in incubations of water samples from an urban pond incubated for one week at three different temperatures without and with addition of NaNO3 and K2HPO4 (+NP) to mimic warming and eutrophication; (b) Total phytoplankton cell concentrations (cells·mL−1) and cell concentrations for potential microcystin (MC) producing species. Error bars indicate 1 SD (n = 3), while different symbols (A,...,D; α,...,δ) indicate groups that are statistically different (Tukey test; p < 0.05).

