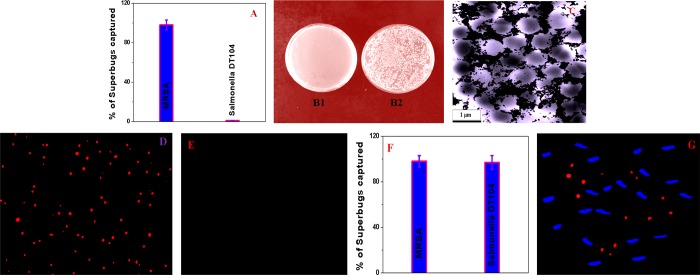
Figure 3.
(A) Bar graph of MRSA removal efficiency using anti-MRSA-antibody-attached red fluorescent magneto-CD nanoparticles. (B1,B2) Agar plates of live MRSA bacteria: (B1) before and (B2) after magnetic separation. (C) TEM image of MRSA capture by anti-MRSA-antibody-attached blue fluorescent magneto-CD nanoparticles. (D) Luminescence image of captured MRSA superbugs by anti-MRSA-antibody-attached nanoprobes. (E) Luminescence image from supernatant after magnetic separation. (F) Bar graph of MRSA and Salmonella DT104 removal efficiency using both anti-MRSA-antibody-attached red fluorescent magneto-CD nanoparticles and anti-Salmonella blue fluorescent magneto-CD nanoparticles. (G) Luminescence image of MRSA and Salmonella superbugs after capture by the two nanoprobes.

