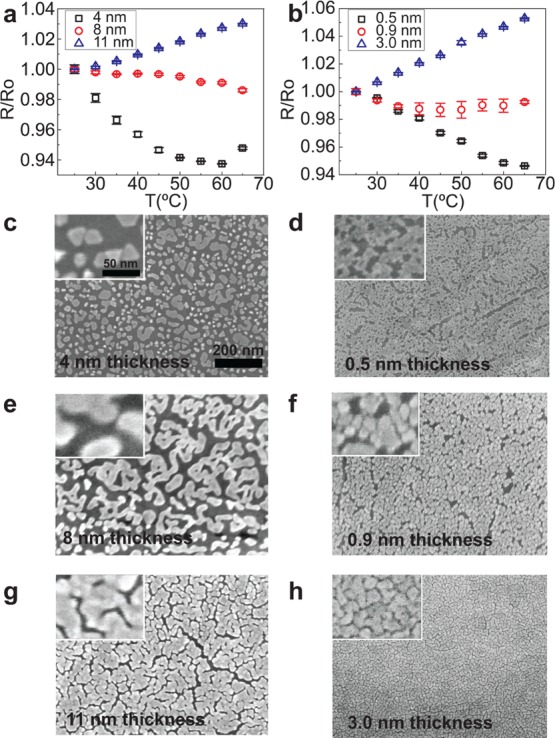
Figure 2.

Thermoresistive behavior and morphology of gold and palladium nanoislands. The temperature-dependent normalized resistance is plotted for gold nanoislands (a) and palladium nanoislands (b) of varied nominal thicknesses. SEM micrographs depicting negative-TCR isolated nanoislands for 3 nm of gold (c) and 0.5 nm of palladium (d), near-zero TCR, partially percolated structures for 8 nm of gold (e) and 0.9 nm of palladium (f), and positive TCR, fully percolated structures for 11 nm of gold (g) and 3.0 nm of palladium (h). All SEM images are under the same magnification.
