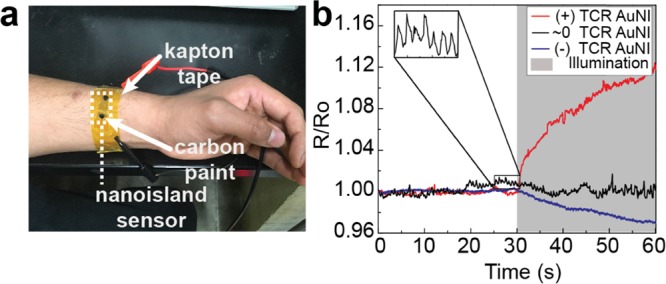
Figure 4.

Thermal drift of a wearable pulse sensor under simulated sunlight. (a) Wearable pulse sensor with the nanoisland portion outlined in black dashed lines. (b) Normalized resistance is plotted versus time with a period of illumination by a solar simulator lamp, which is marked by the gray-shaded area. The lamp heated the sensor to a steady-state temperature of approximately 45 °C after 30 s as measured using an infrared thermometer. The inset shows a clear pulse, with dicrotic notches clearly visible.
