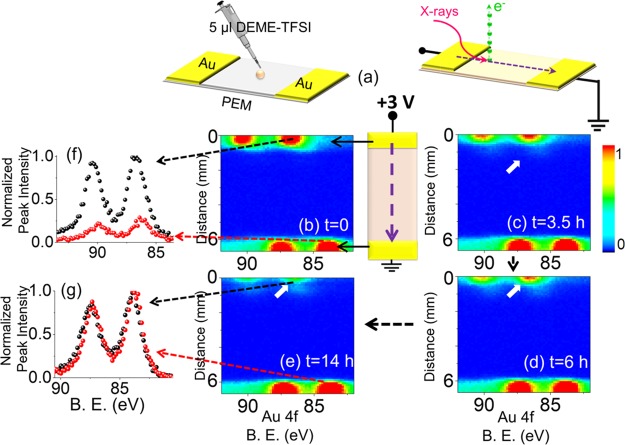
Figure 1.
(a) Schematics of the device. XP spectra of the Au4f region, recorded in the line scan mode from the source toward the drain electrodes; (b) at the beginning of the experiment (t = 0), (c) after 3.5 h (t = 3.5 h), (d) 6 h (t = 6 h) and (e) 14 h (t = 14 h) during the continuous application of +3 V DC external potential. The color bar represents the peak intensities. The schematic illustration represents the line scan direction and the source–drain geometry including the electrical connections. The normalized Au4f spectra from the two points on the line at different positions are given (f) at 500 μm and (g) at 6000 μm away from the polarized electrode.

