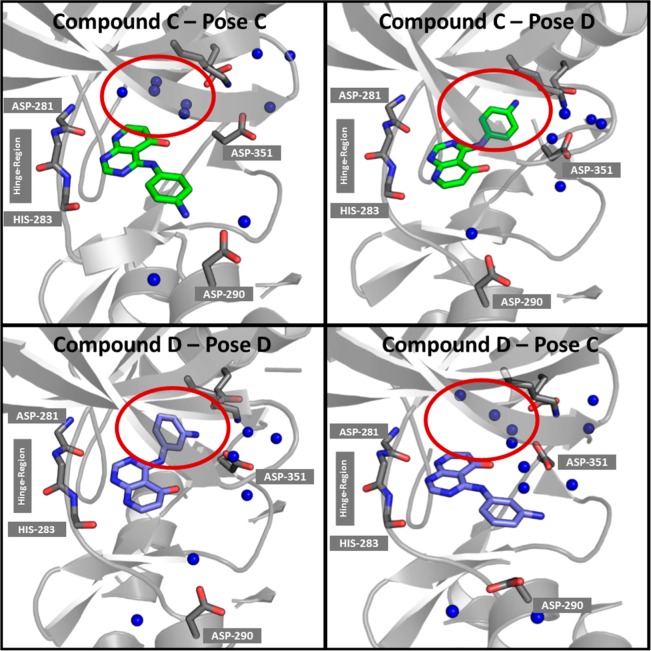
Figure 5.
Visualization of water entropies from the GIST calculation for compounds C and D in both binding poses. Blue spheres indicate water molecules with a low/unfavorable entropy (−TΔS > 3.5 kcal/mol) in a radius of 5 Å around the ligands and the shown ASP-290 and GLU-245 residues. For both compounds binding pose C reveals more entropically disfavored water molecules in the back-pocket (highlighted with red ovals).

