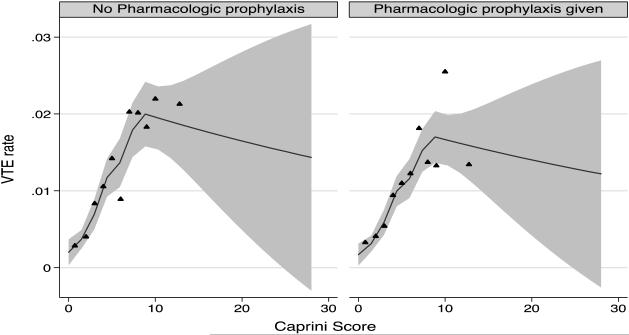
Figure 2. Predicted 90-day VTE by Caprini Score and Receipt of Pharmacologic Prophylaxis.
The predicted 90-day mean VTE rate averaged over hospitals is shown for those with and without pharmacologic prophylaxis with 95% CI. The relationship to Caprini score is modeled as a piecewise linear spline using knots based on the unique quantiles in the data. The triangles are a binned scatterplot of the raw data representing a non-parametric way of displaying the relationship between Caprini score and VTE.

