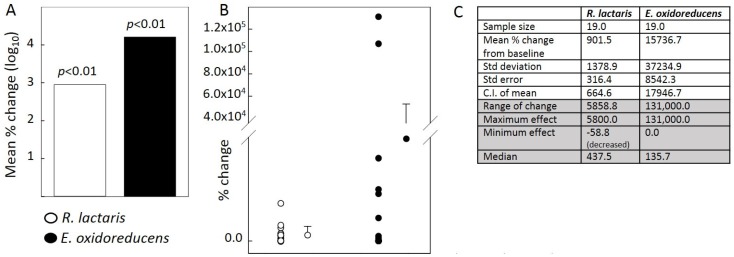
Figure 1.
Data presentation formats. (A) Relative abundance of two bacterial species before and after RS4 treatment shown as mean % change (log10) with corresponding p values; (B) Percent change from before intervention of the same two bacterial species shown as individual data points with means and standard deviations on the side; (C) Descriptive statistical information from the two data sets presented in A and B. The information presented in the last four rows are less frequently reported in clinical trial publications.

