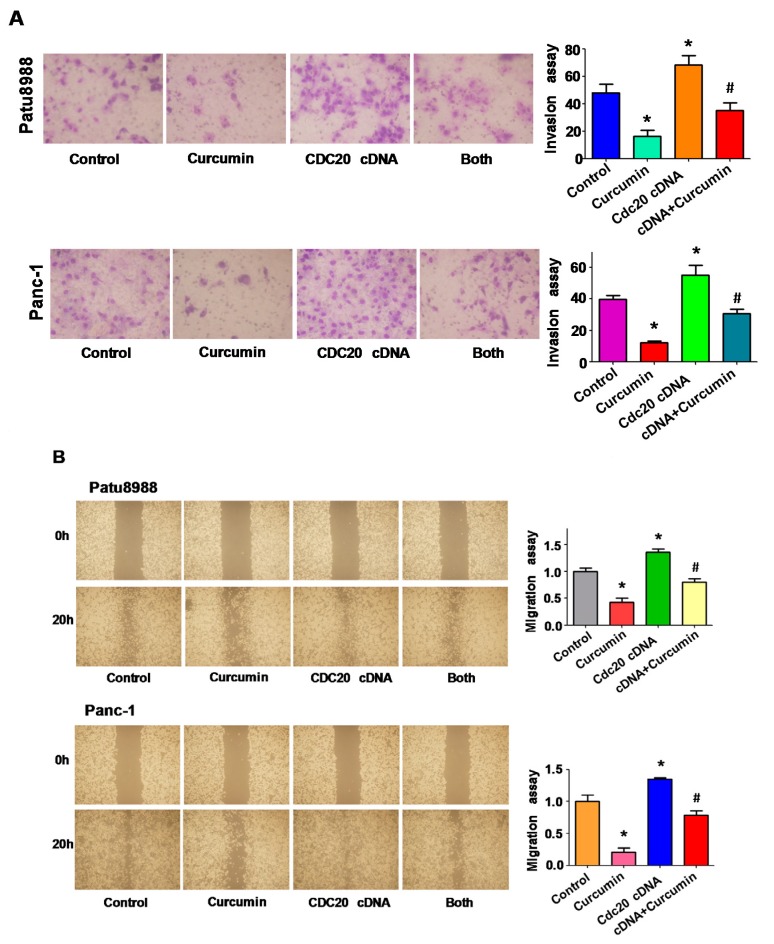
Figure 3.
Overexpression of Cdc20 retarded curcumin-mediated cell motility inhibition. (A) Left panel, invasion assay was conducted in PC cells after Cdc20 cDNA transfection and curcumin treatment. Right panel, quantitative results are illustrated for left panel. * p < 0.05, compared with control; # p < 0.05 compared with curcumin treatment or Cdc20 cDNA transfection alone; (B) Left panel, the wound healing assay was performed to measure the cell migration in PC cells after Cdc20 cDNA transfection and curcumin treatment. Both: Cdc20 CDNA + curcumin. Right panel, quantitative results are illustrated for left panel. * p < 0.05, compared with control; # p < 0.05 compared with curcumin treatment or Cdc20 cDNA transfection alone.

