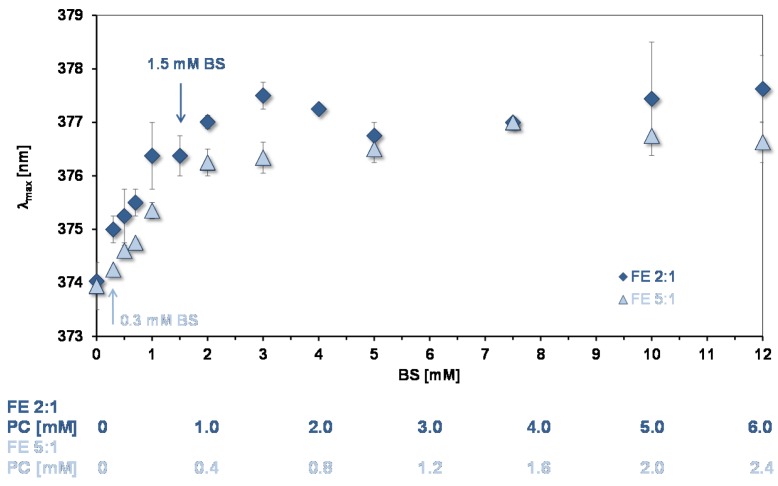
Figure 5.
Bathochromic shift of peak B as a function of mixed micelle concentration (pH = 7.15). The arrows show the concentration of micelles used in the experiments of quercetin uptake by CaCo-2/TC7 cells. The OA concentrations relative to the BS concentrations are as in Table 1.

