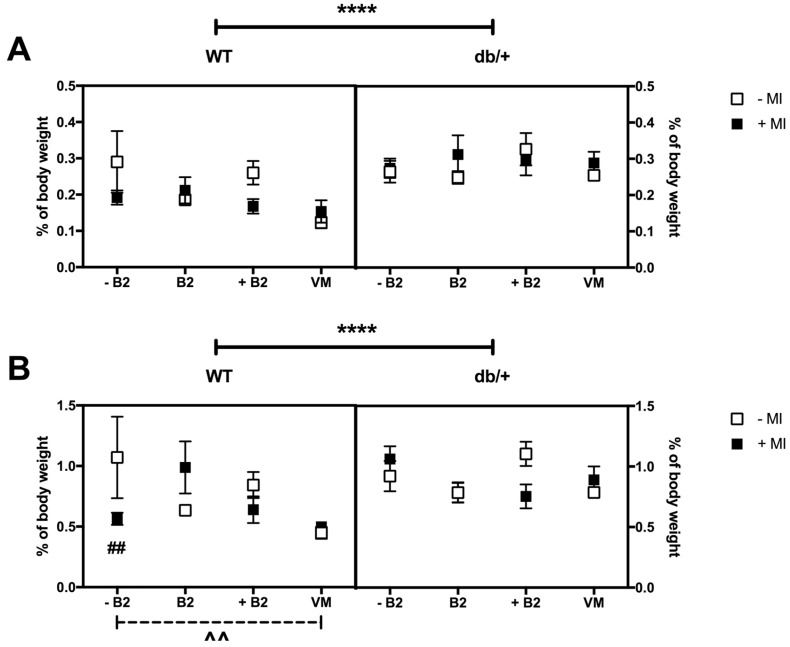
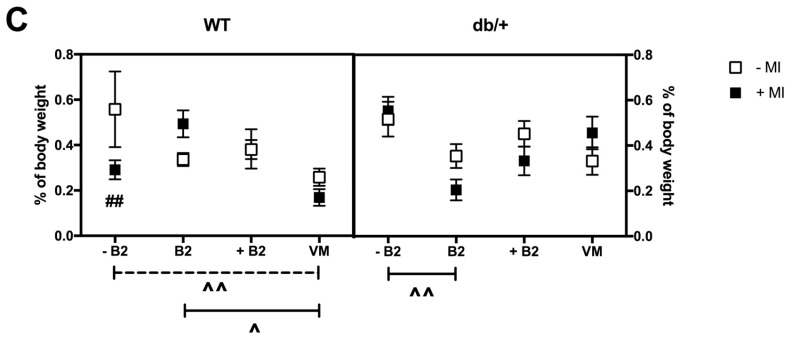
Figure 5.
(A) Retroperitoneal fat deposition at GD18.5 expressed as percentage of total body weight. * indicates a main effect. db/+ mice had significantly more retroperitoneal fat than WT mice, as indicated by **** (p < 0.0001); (B) Gonadal fat deposition at GD18.5 expressed as percentage of total body weight. # indicates a difference between groups with and without MI; and ^ indicates a difference between vitamin status groups, where a dashed line indicates the difference occurs in the group without MI, and a solid line indicates that the difference occurs in the group with MI. db/+ mice had significantly more gonadal fat than WT mice, as indicated by **** (p < 0.0001). There was also a significant difference between WT mice with and without MI in the suboptimal B2 group—as indicated by ## (p = 0.007). In addition, there was a significant difference between WT mice with suboptimal B2 and vitamin mix in the absence of MI—indicated by ^^ (p = 0.006); (C) Perirenal fat deposition at GD18.5 expressed as percentage of total body weight (%). WT mice in the suboptimal B2 group had less perirenal fat when supplemented with MI—as indicated by ## (p = 0.009). In addition, WT mice on suboptimal B2 had more perirenal fat than those on vitamin mix, in the absence of MI, ^^ (p = 0.022). In the presence of MI, WT mice had more perirenal fat in the normal B2 group than the vitamin mix group, ^ (p = 0.023). In db/+ mice, those in the suboptimal B2 group had more perirenal fat than those on normal B2, in the presence of MI, ^^ (p = 0.002). n = 7–12 mice per group.


