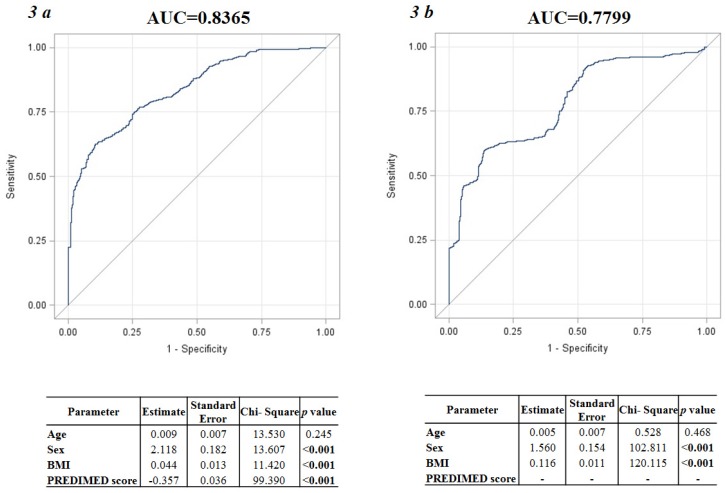
Figure 3.
Linear logistic regression analysis using the PhA AUC as dependent variable and sex, age, and BMI as independent variables, before and after the addition of PREDIMED score in the model. At the fitting model, the AUC significantly increased by 7% once the PREDIMED score was added to the baseline model (AUC = 0.8365 vs. AUC = 0.7799; (a,b) respectively). p value in bold type denotes a significant difference (p < 0.05). PhA, Phase Angle; AUC, Area Under Curve; PREDIMED, PREvención con DIeta MEDiterránea; BMI, Body Mass Index.

