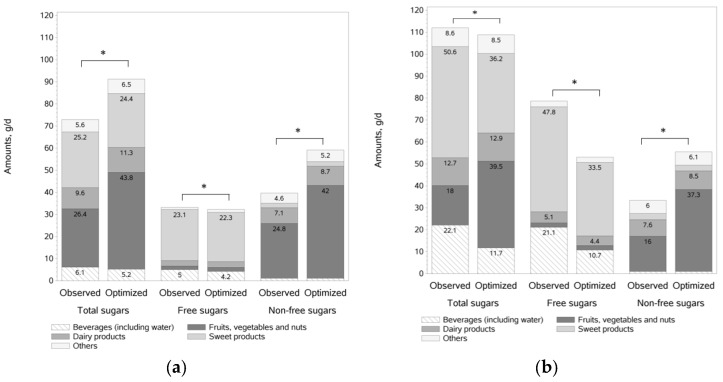
Figure 2.
Amount of sugars (total, free, non-free) 1 in observed and optimized diets (g/d), from main food category contributors in: FS-ACCEPTABLE (a); and FS-EXCESS (b) individuals 2. 1 Amounts of sugars lower than 4 g not labeled; 2 For both FS-ACCEPTABLE and FS-EXCESS, total sugars, free sugars and non-free sugars were significantly different between observed and optimized diets after adjustment for age, gender, energy intake, smoker status, BMI, socio-professional status, composition of the family and sitting time.

