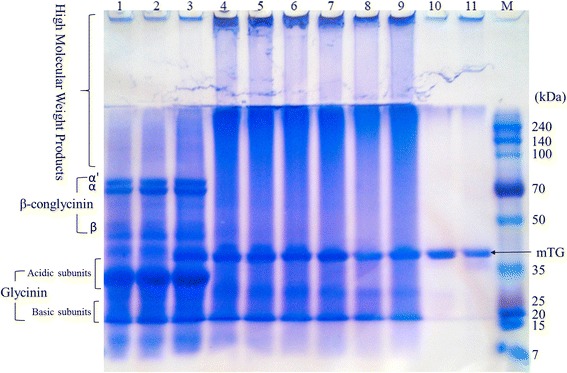
Fig. 5.

SPI crosslinking by S2P mTG for 4 h. From left to right: lanes 1–2 present SPI alone at 0 min and at 4 h; lanes 3–9 show SPI with mTG at 0 min, 15 min, 30 min, 45 min, 1 h, 2 h, 4 h, respectively; lanes 10–11 present mTG alone at 0 min and at 4 h; M is the protein size ladder. The SDS-PAGE was run using 15 μl per well from each fraction
