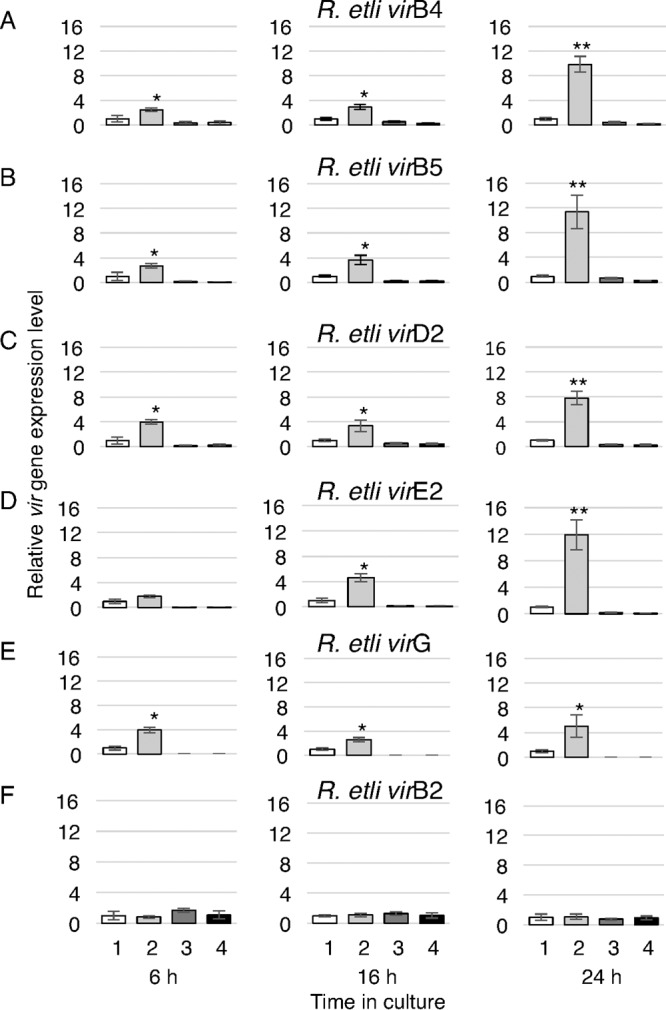
FIG 5.

RT-qPCR analysis of early activation of R. etli vir gene transcription. Relative transcript levels were determined for the R. etli virB4 (A), virB5 (B), virD2 (C), virE2 (D), virG (E), and virB2 genes (F) after 6, 16, and 24 h of growth of the following bacterial cultures: wild-type R. etli without AS induction (bars labeled 1), wild-type R. etli with 50 μM AS induction (bars labeled 2), R. etli ΔvirG without AS induction (bars labeled 3), and R. etli ΔvirG with 50 μM AS induction (bars labeled 4). All data represent average values from two independent biological replicates and three technical replicates with the indicated standard deviations. Asterisks indicate the statistical significance (*, P < 0.05; **, P < 0.01) of the difference between the experimental data for noninduced control and AS-induced cells, as determined by the two-tailed Student's t test.
