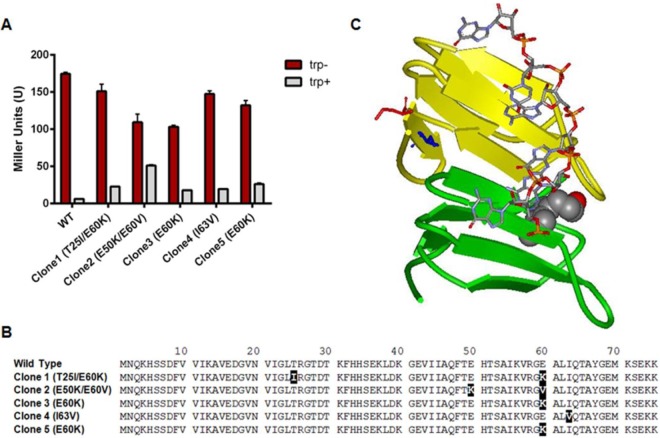
FIG 3.
TRAP mutants from genetic selection/screen. (A) Bar graph showing β-galactosidase activities, in Miller units, expressed from the yhaG-lacZ fusion in the absence (trp−) or presence (trp+) of exogenous tryptophan (50 μg/ml) for 5 CM-resistant clones obtained from B. subtilis NM4909 containing plasmids that express mutant mtrB genes. (B) Amino acid sequences of the wild-type and mutant mtrB genes obtained from the genetic selection/screen, with substitutions highlighted in black boxes. (C) Ribbon diagram of two adjacent TRAP subunits, shown in green and yellow. Tryptophan molecules are displayed as van der Waals spheres, and RNA is shown using stick models in CPK colors. Glu60 and Ile63 are shown as red and blue stick models, respectively.

