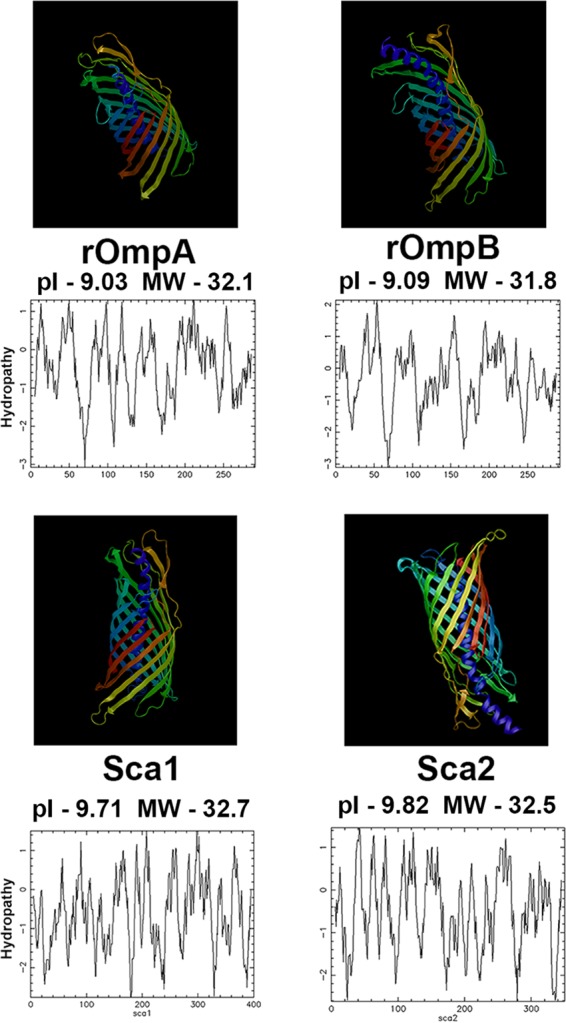
FIG 2.

Structural prediction and hydrophobicity plots of rOmpA, rOmpB, Sca1, and Sca2 autotransporter regions. Amino acid sequences of the autotransporter region of rOmpA, rOmpB, Sca1, and Sca2 were analyzed by the Phyre2 protein modeling and prediction program. The model is colored based on sequence position from the N (blue) to the C (red) terminus. Ribbons represent β pleated sheets, coils represent α helices, and thin strands represent amino acid chains not predicted to affect secondary structure. Hydropathy plots of the autotransporter regions were created using EMBOSS Pepwindow. MW, molecular weight (in thousands).
