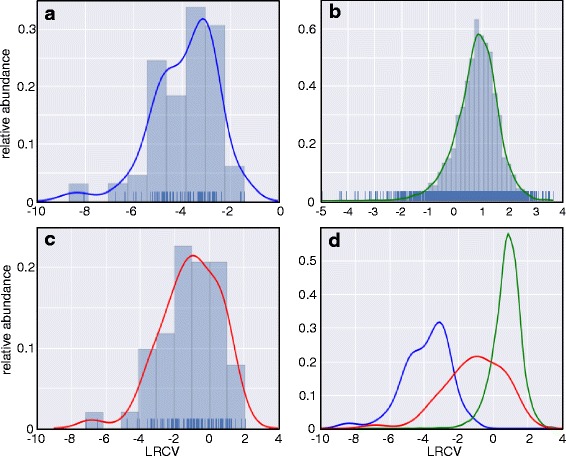
Fig. 1.

Logarithmic (ln) ribosomal coverage (LRCV) of tRNAs, annotated genes, annotated ncRNAs and a merger of the former. a Histogram of the LRCVs (X-axis) of the tRNAs together with either the estimated density function (blue curve). The density of the individual tRNAs is shown as little blue bars on top of the X-axis. b LRCV histogram as before, but of the annotated genes and their estimated density function (green). c LRCV histogram as before, but of the known ncRNAs (see Table 1) together with their estimated density function (red). d A combination of the estimated density functions for the tRNAs (blue), the annotated genes (green) and the ncRNAs (red) of the former panels, shown a substantial overlap between the annotated genes and the ncRNAs supposedly non-coding
