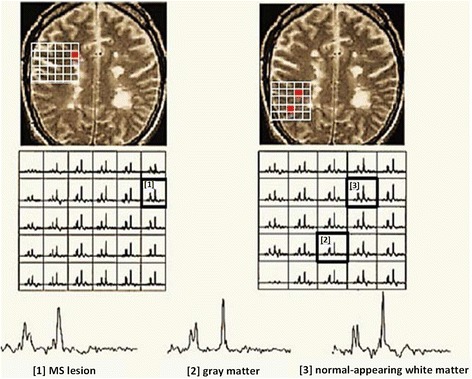
Fig. 12.

Spectroscopic data from a typical SPMS brain from three separate regions: [1] MS lesion, [2] CGM and [3] NAWM. The voxels are represented by the numbers and red spots. Experimental parameters: 3D-EPSI (TE/TR = 144/2000 ms), acquisition time (20 min), FOV (24 × 24 × 8 cm3) and slice thickness (4 mm) at 1.5 T. Reproduced with permission from [114]
