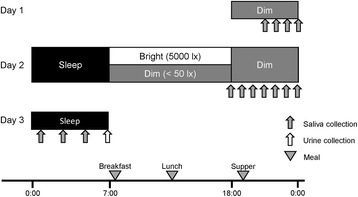
Fig. 1.

The experimental protocol. Horizontal bars indicate experimental light conditions; gray, black, and white represent dim (<50 lx), dark (0 lx), and bright (>5000 lx) lights, respectively. Arrows indicate the times of data collection; gray and white arrows indicate saliva and urine collection times, respectively. Gray triangles show the times of meals
