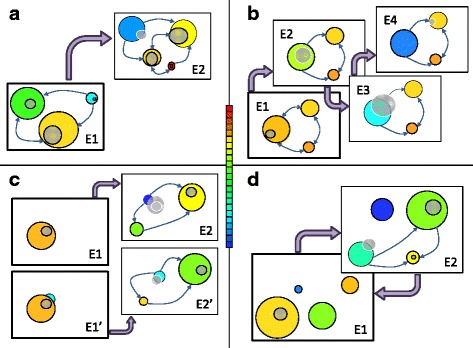
Fig. 5.

Schematic representation of examples of adaptation in the framework of adaptive multiscapes. Initial environments are labeled E1 and E1’, and different subsequent environments correspond to labels E2, E2’, E3, and E4. We use stilized representations of populations at equilibrium in an environment (grey circles with black boundary) or during adaptive transients (grey circles with white boundary). Only meaningful and likely links between phenotypes in the depicted situation are shown (note the direction of arrows). Large violet arrows stand for environmental transitions. a Distribution of viral populations. Even at equilibrium, these populations maintain high levels of genotypic and phenotypic diversity in their current environments (E1). E2 represents an environment where the population is poorly adapted initially (in the blue phenotype) so it needs to search the genotype space to find and fix advantageous mutations. After the initial bottleneck, it spreads over different phenotypes again. b Drift and switch between neutral networks. Punctuation in the phenotype is enhanced by the loss of fitness of the current phenotype, which here occurs concomitantly with the exploration (search) of the neutral genotype network. A short sequence of intermediate environments is shown (E2, E3, E4). c Effects of gene duplication. The fate of a duplicated gene depends on the existence of a secondary function prior to duplication. In its absence (neofunctionalization, E1, E2) the gene can acquire random mutations and explore the surrounding genotype space. If a secondary function was present (subfunctionalization, E1’, E2’), there is a viable phenotype subjected to a selection pressure that might be rapidly optimized in E2’. In both cases, evolutionary optimization begins once a function is fulfilled. d Waddington’s canalization of an acquired character. In the language of adaptive multiscapes, a subset of genotypes in the population expresses different phenotypes in E1 or E2. Under selection (both natural and artificial) in E2, the population modifies its genomic composition, such that if E1 is restored the population will no longer express the original phenotype (there is no overlap between the equilibrium population in E2 and the orange phenotype in E1)
