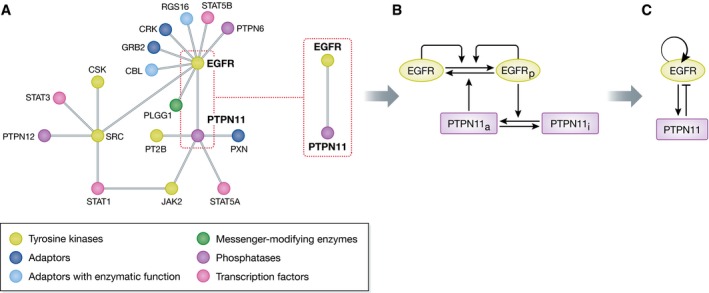
Figure 2. Different perceptions of protein interaction networks.

(A) Schematic representation of a subset of the epidermal growth factor receptor (EGFR) interaction network as obtained from proteomics approaches (adapted from Kiel et al, 2013). In this case, the edges represent any form of interaction and the nodes represent the proteins. This type of representation provides information, which proteins work together to generate cellular functionality, but do not allow to extract information on this functionality. (B) One interaction between EGFR and a protein tyrosine phosphatase PTPN11 (SHP2) is highlighted for which the complete details of the chemical conversions (horizontal arrows) and the causalities between the communicating chemical intermediates (vertical arrows) are depicted. (C) The causality alone is sufficient to identify all possible dynamical solutions of the two component network module and describe its functionality.
