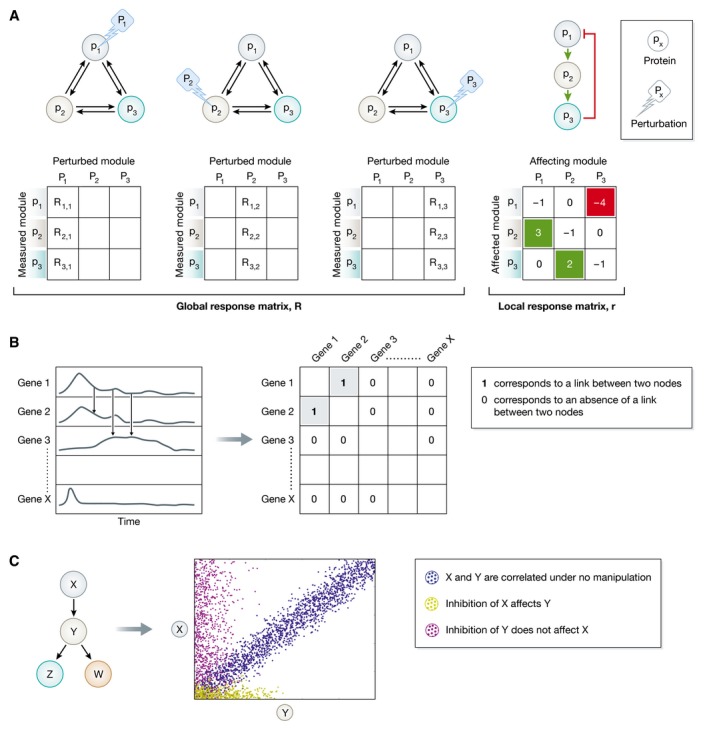
Figure for Box 5. Methods for network reconstruction.

(A) Schematic representation of MRA (adapted from Zamir & Bastiaens, 2008). The upper left graphs depict a network of three proteins (p1, p2, p3) for which network reconstruction is applied to uncover the strength and sign of the six possible causal connections. Perturbing (Pi) each of the nodes and measuring the corresponding response of all nodes in the network allows to obtain the nine global response coefficients from which the local response coefficients are computed. These indicate the causal connectivity strength in both directions between p1, p2, and p3 (right graph). (B) Schematic representation of time series measurements as obtained from a transcriptomics experiments (left chart). To reconstruct the gene regulatory network, the pairwise similarity between the time series is calculated. This allows generating an association matrix (right table) from where the links between the nodes can be deduced. 1 corresponds to a link between gene 1 and gene 2, and 0 corresponds to an absence of an edge between the two nodes. (C) Simplified representation of how Bayesian network operates on a hypothetical network of four proteins, X, Y, Z, and W, as adapted from Sachs et al (2005). Each dot represents the amount of two phosphorylated proteins (X and Y) in a single cell. X and Y are correlated under no manipulation (blue dots). Inhibition of X affects Y (yellow dots), whereas the opposite is not true (magenta dots). This reveals the directionality of the interaction from X to Y.
