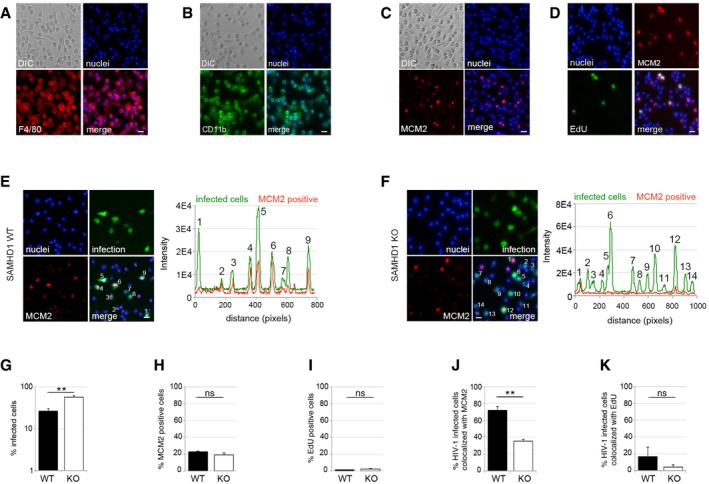
Figure 4. HIV‐1 tropism for murine tissue‐resident macrophages at the cellular level.

-
A–DPeritoneal macrophages from 6‐ to 10‐week‐old C57BL/6 mice were stained for the macrophage markers (A) F4/80, (B) CD11b, (C) MCM2 or (D) active DNA synthesis (EdU) 2 h after isolation. Scale bars: 20 μm.
-
E–KPeritoneal macrophages were isolated from 6‐ to 10‐week‐old WT or SAMHD1−/− (KO) mice. Cells were infected with VSV‐G‐pseudotyped HIV‐1 GFP for 48 h and analysed for (G) infection, (H) MCM2 expression, (I) EdU incorporation (EdU was added at the time of infection), and co‐localisation between infection and (J) MCM2 protein or (K) active DNA synthesis (by EdU incorporation). (E, F) Random microscopic fields and plot profiles show an example of immunofluorescence intensity along infected cells. Scale bars: 10 μm. On average, 104 cells in each experiment were recorded and analysed using Hermes WiScan cell‐imaging system and ImageJ (n ≥ 2, mean ± s.e.m.; (ns) non‐significant; **P‐value ≤ 0.01, unpaired t‐test).
