-
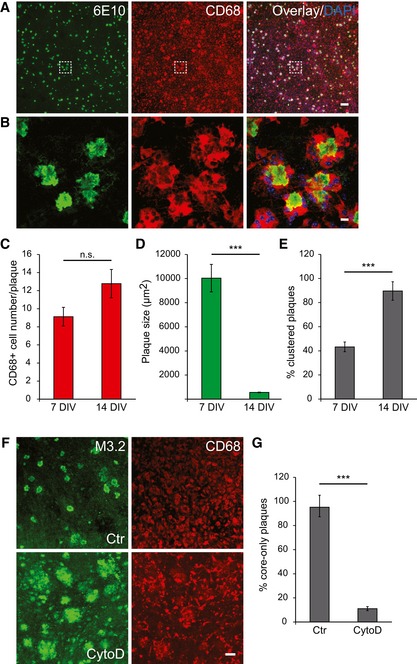
A, B
Immunofluorescence analysis of the old APPPS1 slice in co‐culture (14 DIV) using antibodies 6E10 (green) and CD68 (red). Nuclei were counterstained using DAPI (blue). Image of boxed region in (A) is depicted at higher magnification in (B) and reveals clustering of several CD68‐positive cells around amyloid plaques. Scale bars: 100 μm (A) and 10 μm (B).
-
C
Quantitative analysis of plaque‐associated CD68‐positive cells in co‐culture samples at 7 and 14 DIV reveals a trend toward increased number of CD68‐positive cells. The values represent mean ± SEM from at least three independent experiments, including total of at least six independent slice culture dishes (n.s. = not significant; unpaired two‐tailed Student's t‐test).
-
D
Quantitative analysis of co‐culture samples at 7 and 14 DIV reveals a decrease in plaque size. The values represent mean ± SEM from at least three independent experiments, including total of at least six replicates (***P < 0.001; unpaired two‐tailed Student's t‐test).
-
E
Quantitative analysis of plaques surrounded by CD68‐positive cells (clustered plaques) in co‐culture samples at 7 and 14 DIV reveals an increase in the number of clustered plaques. The values are expressed as percentages of clustered plaques from the total number of amyloid plaques. The values represent mean ± SEM from at least three independent experiments, including total of at least six independent slice culture dishes (***P < 0.001; unpaired two‐tailed Student's t‐test).
-
F
Immunofluorescence analysis of the old APPPS1 slice in co‐culture (14 DIV) treated with cytochalasin D (CytoD) and vehicle control (Ctr) and immunostained with M3.2 (green) and CD68 (red). Inhibition of phagocytosis by CytoD blocks amyloid plaque clearance. Scale bar: 50 μm.
-
G
Quantitative analysis of core‐only plaques in the old APPPS1 slice in co‐culture (14 DIV) treated with CytoD and Ctr reveals a decreased number of core‐only plaques upon CytoD treatment. The values are expressed as percentages of core‐only plaques from the total number of amyloid plaques. The values represent mean ± SEM from three independent experiments, including total of six independent slice culture dishes (***P < 0.001; unpaired two‐tailed Student's t‐test).