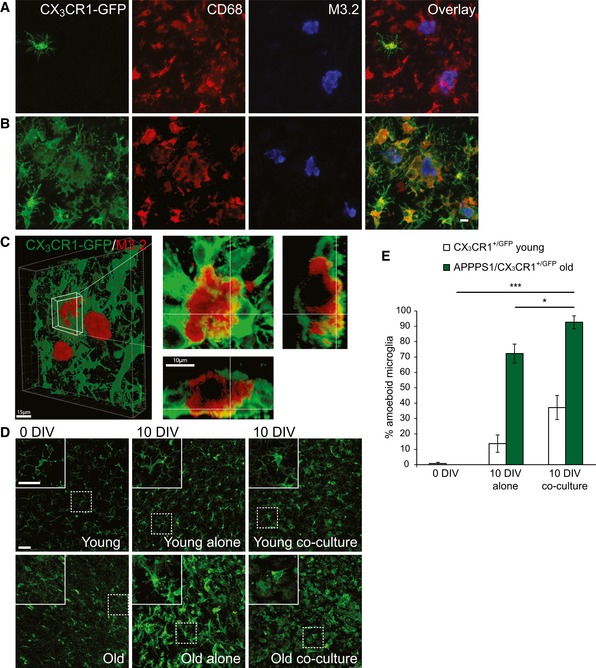
Immunofluorescence analysis of the old APPPS1 slice in co‐culture with the young CX3CR1+/GFP slice (14 DIV) and immunostained using GFP (green), CD68 (red), and M3.2 (blue) reveals no co‐localization of young, GFP‐positive microglial cells with CD68‐positive cells surrounding amyloid plaques. A GFP antibody was used to amplify the signal of GFP‐expressing young microglial cells.
Immunofluorescence analysis of the old APPPS1/CX3CR1+/GFP slice in co‐culture with the young WT slice (14 DIV) and immunostained using GFP (green), CD68 (red), and M3.2 (blue) reveals co‐localization of old, GFP‐positive microglial cells with CD68‐positive cells surrounding amyloid plaques. A GFP antibody was used to amplify the signal of GFP‐expressing old microglial cells. Scale bar: 10 μm (applies to panels A and B).
3D reconstruction of the old APPPS1/CX3CR1+/GFP slice in co‐culture with the young WT slice (10 DIV) and immunostained using GFP (green) and M3.2 (red). GFP‐positive old microglial cells surrounding amyloid plaques exhibit intracellular M3.2‐positive immunoreactivity indicative of Aβ uptake. Overview at low magnification is shown in the left panel. Scale bar: 15 μm. A detailed plaque is shown at higher magnification in the right panels. Scale bar: 10 μm.
Immunofluorescence analysis of young CX3CR1+/GFP and old APPPS1/CX3CR1+/GFP slices freshly cut (0 DIV), cultured alone or in co‐culture (10 DIV), and immunostained using GFP (green) shows alterations in microglial morphology of old cells upon culturing. Upper left panels are enlargements of boxed regions. A GFP antibody was used to amplify the signal of GFP‐expressing microglial cells. Scale bars: 50 μm.
Quantitative analysis of amoeboid microglial cells in young CX3CR1+/GFP (white bars) and old APPPS1/CX3CR1+/GFP (green bars) brain slices freshly cut (0 DIV), cultured alone or in co‐culture (10 DIV). The values are expressed as percentages of amoeboid microglia from the total number of microglial cells. The values represent mean ± SEM from three independent experiments, each experiment including at least 250 cells per condition (*P < 0.05, ***P < 0.001; unpaired two‐tailed Student's t‐test).

