
Figure 1. Isogenic cell system employed to study the effects of BRAFWT and BRAFV600E on the composition of cytosolic macromolecular protein complexes.
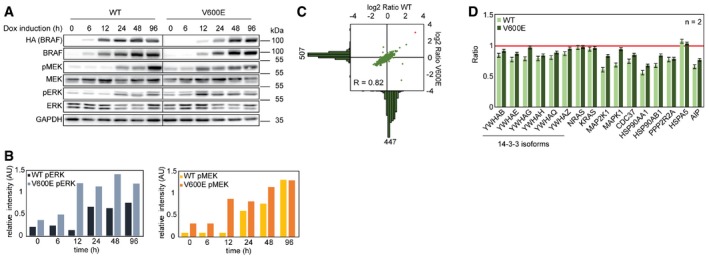
- The time‐dependent effect of HA‐BRAFWT (WT) and HA‐BRAFV600E (V600E) expression in CaCo‐2 cells is monitored by Western blot. Expression of HA‐tagged fusion constructs is induced for the annotated timeframes by the addition of doxycycline (Dox). Effects of oncogene expression are monitored by the abundance of the downstream target sites pMEK and pERK. Vertical line indicates two separately blotted gels.
- Quantifications of blots shown in panel (A) normalized to the GAPDH signal.
- To analyze effects of oncogene overexpression on global protein abundance, SILAC‐labeled cells overexpressing WT and V600E are compared to Dox‐treated unlabeled vector control cells (ctrl). Histograms highlight detected protein numbers. BRAF is marked in red.
- Abundance differences of known and newly identified BRAF binding partners are shown comparing WT‐ and V600E‐expressing cells with vector control cells. Red line indicates levels in vector control cells. Error bars indicate standard deviation.
Source data are available online for this figure.