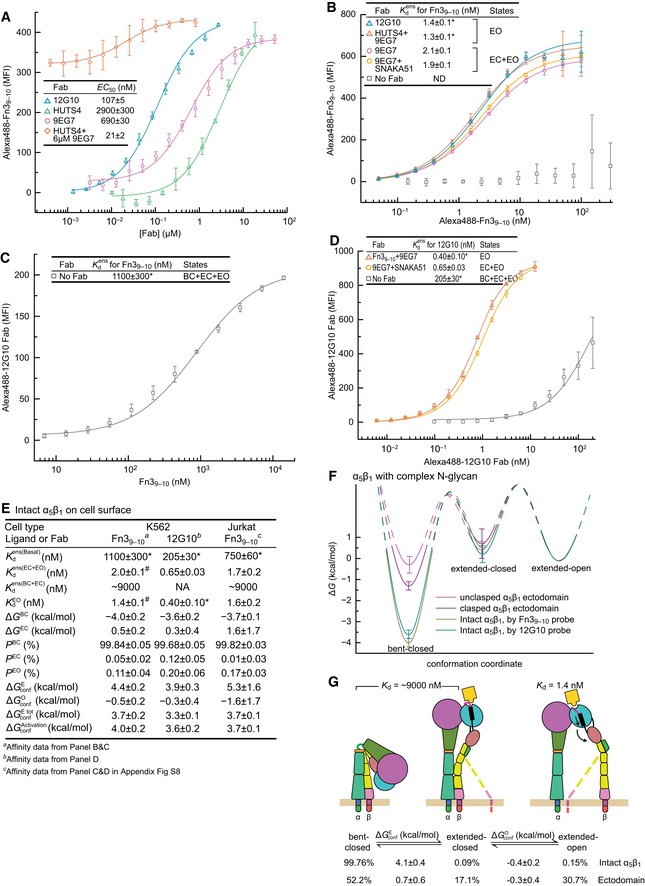
Figure 7. Conformational equilibria and intrinsic affinity of intact α5β1 on cell surfaces.

- Determination of EC50 values for conformation‐selective Fabs from enhancement of 10 nM Alexa488‐Fn39–10 binding and fitting to Appendix Equation S2. Mean ± s.d. of least square fits to triplicates.
- Affinity of α5β1 for Alexa488‐Fn39–10 in the presence of indicated Fabs.
- Affinity of α5β1 for Fn39–10 by enhancement of 0.4 nM Alexa488‐12G10 Fab binding.
- Affinities of α5β1 for Alexa488‐12G10 Fab in the presence of indicated Fabs.
- Thermodynamics and intrinsic affinities of α5β1 conformational states on K562 cells and Jurkat cells (Appendix Fig S8). Affinity for Fn39–10 of the closed conformations of α5β1 on K562 cells was estimated from using the same fold‐difference as found with Fn39–10 for the α5β1 ectodomain (Fig 4D). Since 12G10 stabilizes the open conformation only, thermodynamic calculations use K a = 0 for the closed conformations.
- Summary of the intrinsic affinities of α5β1 conformational states on K562 cells and comparison of the conformational equilibria for α5β1 on K562 cells and for the unclasped α5β1 ectodomain with complex glycosylation.
