
Extended Data Figure 5. HITI-mediated GFP knock-in in neurons in vitro and in vivo.
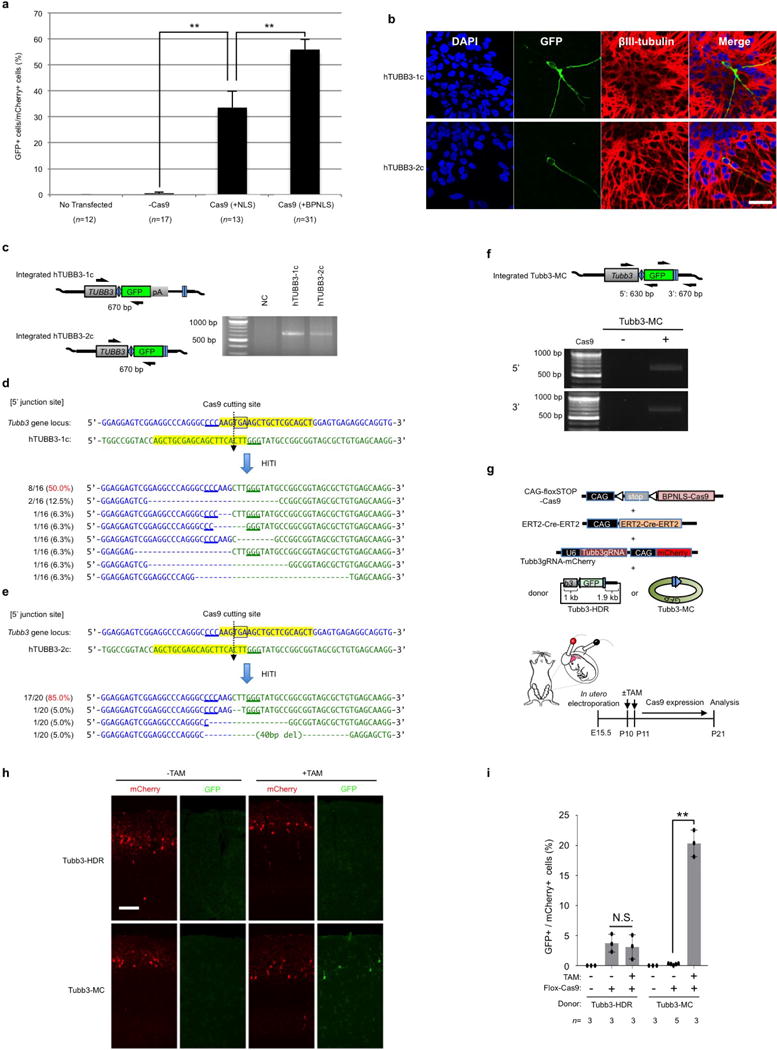
a, The percentage of knock-in (GFP+) cells in mouse primary neurons per transfected cells (mCherry+) with empty vector (−Cas9), Cas9 (+NLS) and Cas9 (+BPNLS). n, number of technical replicates. Results were presented as mean ± s.e.m. **P< 0.01, unpaired Student’s t-test. b, Representative immunofluorescence images of human ES cell-derived pan neurons transfected with BPNLS-Cas9, gRNA, and different donor plasmids (hTUBB3-1c or hTUBB3-2c). Scale bar, 100 μm. c, PCR analysis of integrated GFP gene at TUBB3 locus in human ES cell-derived pan neurons. d, e, Sequences of the 5′ junction sites after GFP knock-in by HITI in human ES cell-derived pan neurons with TUBB3-1c donor (d) and TUBB3-2c donor (e). f, Upper panel, schematic of GFP knock-in at the 3′ end of the Tubb3 coding region via Tubb3-MC donor in the neonatal mouse brain. Black half-arrows indicate PCR primers for detecting integrated sequences. Lower panel, genomic PCR results showing transgene integration at both 5′ and 3′ ends. g, Schematic of in vivo targeted GFP knock-in by HITI in the neonatal mouse brain. CAG-floxSTOP-Cas9, inducible BPNLS-Cas9 expression plasmid. ERT2-Cre-ERT2, tamoxifen (TAM) inducible Cre expression plasmid. Donor plasmids: Tubb3-HDR or Tubb3-MC. Tamoxifen was injected at P10 and P11. Mice were analysed at P21. h, Representative fluorescence images of GFP knock-in at the Tubb3 locus in neonatal mouse brain by inducible Cas9 expression with HDR donor (Tubb3-HDR) or minicircle HITI donor (Tubb3-MC). Scale bar, 100 μm. i, Relative knock-in efficiencies of HDR and HITI donors with or without tamoxifen treatment. n, number of pups obtained from two pregnant mice. Results were presented as mean ± s.d. The input data points were shown as black dots. **P <0.01. N.S., not significant. Unpaired student’s t-test. For gel source images, see Supplementary Fig. 1. For source data, see Supplementary Table 9.