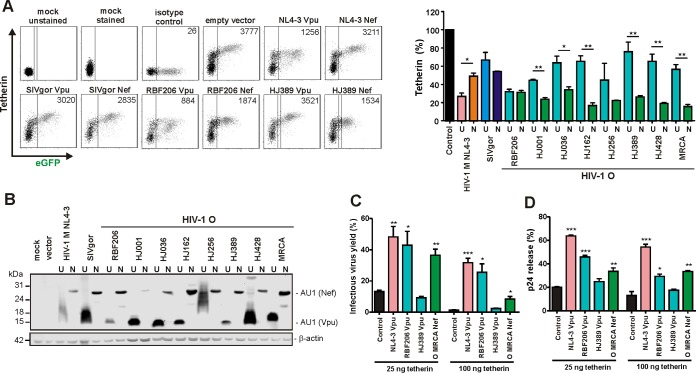
FIG 1.
Functional characterization of HIV-1 RBF206 Vpu and Nef proteins. (A) Effects of Nefs and Vpus on surface expression of human tetherin. Shown is flow cytometry analysis of HEK293T cells cotransfected with a tetherin expression vector and pCG plasmids expressing eGFP alone or together with the indicated vpu (U) or nef (N) alleles. The left side shows examples of primary flow cytometry data obtained 24 h posttransfection. The right side shows the levels of tetherin surface expression in the presence of Vpu or Nef relative to that in cells transfected with the control vector (100%, shown in black). The NL4-3 controls are shown in pink (Vpu) and orange (Nef), the SIVgor controls are shown in light blue (Vpu) and dark blue (Nef), and the O-Vpus are shown in turquoise and the O-Nefs in green. eGFP expression ranges used to calculate receptor downmodulation and the mean fluorescence intensities (MFIs) are indicated in the primary data. (B) Expression of Vpu and Nef proteins. HEK293T cells were transfected with plasmids encoding the indicated Vpu or Nef proteins, tagged with AU1, and analyzed by Western blotting. An empty vector and mock-transfected cells were used as controls. (C) Effects of various Vpus and the O-MRCA Nef on infectious virus yield. HEK293T cells were cotransfected with an HIV-1 NL4-3 Δvpu Δnef construct, pCG vectors coexpressing eGFP and Vpu or Nef, and increasing amounts of a construct expressing human tetherin. Viral supernatants were obtained 2 days later and used to measure infectious HIV-1 yield in the culture supernatants by infection of TZM-bl indicator cells. Shown are average infectious virus yields relative to those detected in the absence of tetherin (100%). (D) Effects of various Vpus on p24 release. HEK293T cells were transfected as described for panel C, and the levels of p24 in the culture supernatant and cell extracts were determined by ELISA. p24 release represents the p24 quantity in the supernatant relative to the total p24 amount in the supernatant and cellular extracts (100%). Values in all bar diagrams represent averages (± SEM) from three independent experiments. *, P < 0.05; **, P < 0.01; ***, P < 0.001.

