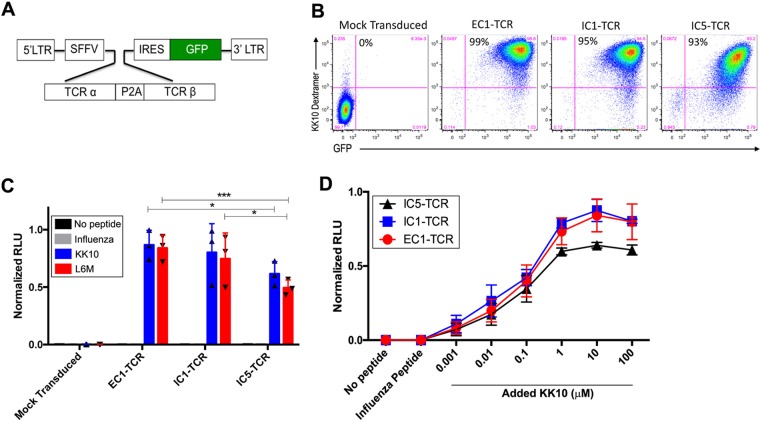
FIG 5.
Phenotypic and functional analysis of the EC1, IC1, and IC5 TCRs expressed by the transduced Jurkat/MA cells. (A) The TCR α and β genes of effective (EC1) and ineffective (IC1 and IC5) CD8+ T-cell clones were cloned into a lentiviral transfer vector driven by a spleen focus-forming virus (SFFV) viral promoter. TCR α and β genes were linked by a self-cleaving P2A peptide followed by an IRES-driven GFP marker gene to allow visualization of the transduced cells by flow cytometry. (B) Efficiency of Jurkat/MA cell transduction by the GFP-expressing EC1-TCR, ICI-TCR, and IC5-TCR lentiviral vectors and their expression of a KK10-specific TCR were determined by flow-cytometric analysis 72 h after transduction by staining with HLA-B*2705-KK10 dextramer. (C) TCR responsiveness was measured by incubating mock-transduced and EC1-TCR-, IC1-TCR-, or IC5-TCR-transduced Jurkat/MA cells with CTR0075 cells pulsed with the indicated peptide (10 μM) for 16 h and quantifying luciferase activity in cellular lysates. (D) Functional activity of the EC1-TCR, IC1 TCR, and IC5-TCR expressed by the Jurkat/MA cells was determined by stimulating the transduced cells with CTR0075 cells pulsed with the indicated concentration of KK10 peptide or a control influenza virus peptide (10 μM) for 16 h and measuring luciferase activity. The data shown in panels C and D are normalized relative luciferase unit (RLU) values from 3 individual experiments performed in duplicate. We normalized the data from 3 experiments to aid in accurate comparison between individual experiments using the formula Xi, 0 to 1 = (Xi − Xmin)/(Xmax − Xmin), where Xi represents each data point, Xmin is the minimum among all data points in an experiment, Xmax is the maximum among all data points in an experiment, and Xi, 0 to 1 represents the data point i normalized between 0 and 1. The data shown are the mean normalized RLU ± standard errors of the means (SEM) from 3 experiments performed in duplicate. Statistical significance was evaluated using the 2-way analysis of variance (ANOVA) test. *, P < 0.05; ****, P < 0.0001.

