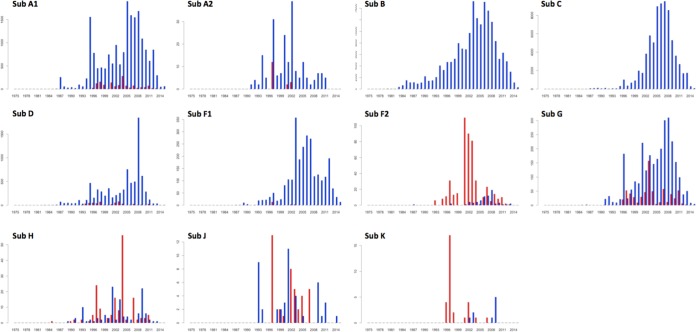
FIG 8.
Frequency of sampling of major subtypes of HIV-1. Red bars, sampling within the Congo Basin; blue bars, sampling outside the Congo Basin. The y axes are not proportional. The numbers on the y axes represent the number of genotypes (>500 bp), while the numbers on the x axes represent years in calendar time. Sub, subtype.

