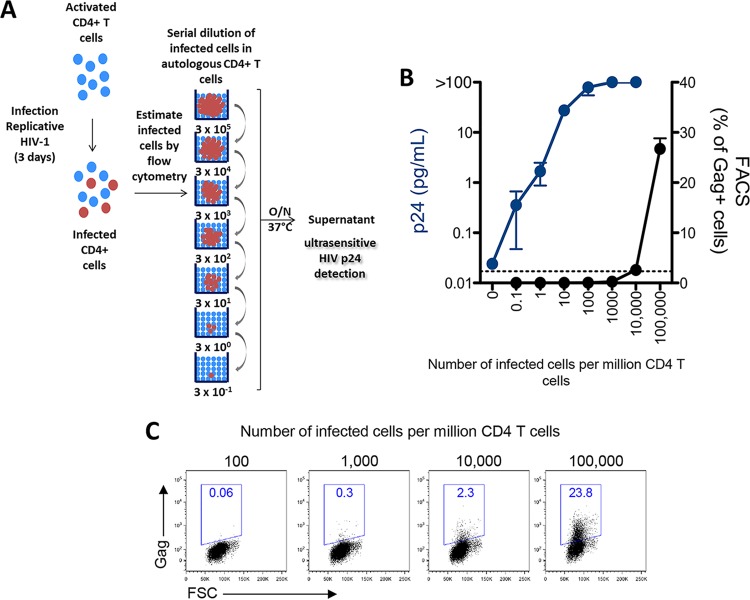
FIG 2.
Comparison of the sensitivities of flow cytometry and the ultrasensitive digital immunoassay for the detection of HIV-1-infected cells. (A) PHA-activated CD4+ T cells were infected with the HIV-1 NL4-3 strain for 3 days. The frequency of infected CD4+ T cells was determined by flow cytometry. Infected CD4+ T cells were then serially diluted to assess Simoa p24 sensitivity (1 to 1 × 10⁵ infected cells were added to 106 autologous uninfected T cells for 24 h). (B) Quantification of HIV p24 by ultrasensitive digital immunoassay in the cell supernatants (in blue). Results for one representative donor are represented. The lower limit of quantification (LOQ) is indicated by a dashed line (0.017 pg/ml). The frequency of Gag+ cells reevaluated by flow cytometry after 24 h of culture is shown in black. (C) Representative dot plots of cultures estimated to contain 102 to 105 infected cells are depicted. FACS, fluorescence-activated cell sorting; FSC, forward scatter; O/N, overnight.

