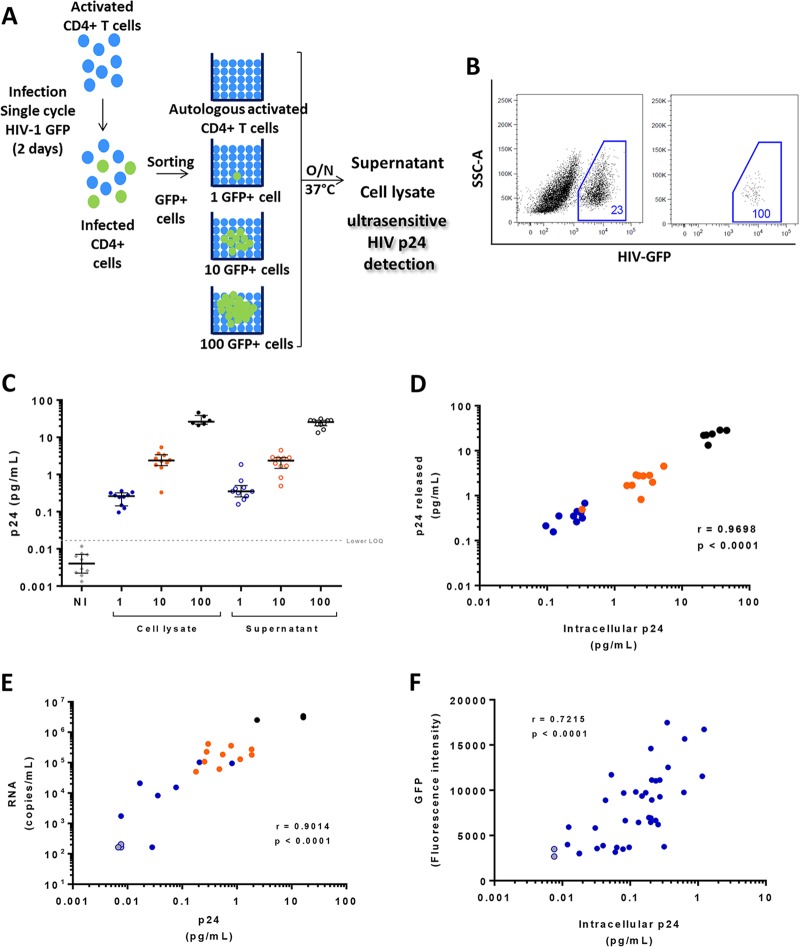
FIG 3.
Detection of HIV p24 at a single-cell level by ultrasensitive digital immunoassay. (A) Activated CD4+ T cells were infected with single-cycle NL4-3ΔenvΔNef/GFP HIV-1 particles pseudotyped with VSV-G. GFP+ CD4 T cells were sorted at 1, 10, or 100 cells per well and kept overnight in culture with 20,000 activated CD4+ T cells from the same noninfected donor. Quantification of p24 by ultrasensitive digital immunoassay was performed in both cell lysates and culture supernatants. (B) At left is a representative dot plot of activated CD4+ T cells infected for 48 h with single-round NL4-3ΔenvΔNef/GFP HIV-1 particles pseudotyped with VSV-G. Levels of infection (GFP+ cells) ranged from 20% to 30%. At right is a representative dot plot of activated CD4+ T cells infected for 48 h with single-round NL4-3ΔenvΔNef/GFP HIV-1 particles pseudotyped with VSV-G and sorted at a single-cell level. The purity of GFP+ cells sorted at a single-cell level was 100%. SSC-A, side scatter area. (C) Quantification of intracellular HIV p24 and the corresponding supernatant by ultrasensitive digital immunoassay from sorted GFP+ CD4+ T cells after 18 h of culture. Cell lysates are indicated by filled symbols, supernatants are represented by open symbols. Blue, orange, and black symbols represent 1, 10, and 100 infected cells, respectively. Gray diamonds represent noninfected CD4+ T cells. Heavy horizontal bars denote median values, and light horizontal bars indicate interquartile ranges. The lower limit of quantification is indicated by the dashed line (0.017 pg/ml). (D) Relationship between the amount of intracellular p24 and released p24 present in supernatant after culture overnight. Blue, orange, and black symbols represent 1, 10, and 100 infected cells, respectively. (E) Relationship between the amount of p24 and RNA in culture supernatant. Blue, orange, and black symbols represent 1, 10, and 100 infected cells, respectively. Three samples were below the limit of quantification with both techniques and are represented by gray circles. Arbitrary values were assigned to represent these negative points. (F) Relationship between the amount of intracellular p24 and GFP expression recorded during single-cell index sorting (DIVA; BD Bioscience). Two samples that were below the limit of quantification with the ultrasensitive p24 assay are represented by gray circles. All correlations were calculated using a nonparametric Spearman test.

