
FIG 6.
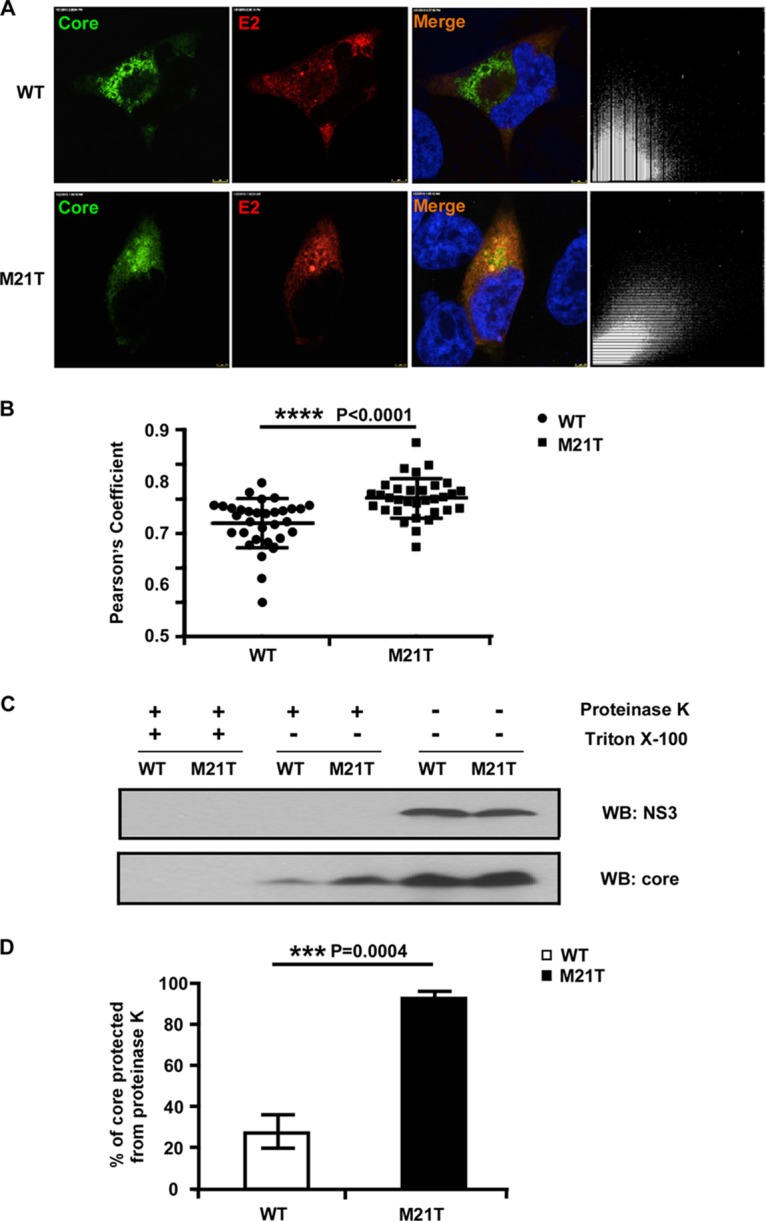
The M21T mutation promoted envelopment of viral nucleocapsid. (A) Confocal immunofluorescence analysis of core and E2 colocalization. Huh7.5.1 cells were electroporated with full-length JFH1 RNA containing WT or M21T NS3 for 3 days and subjected to immunofluorescence staining of core (green) and E2 (red). The colocalization of core and E2 was analyzed in pixel dot plots on the right, with the x axis representing red signal intensity (E2) and the y axis representing green signal (core). (B) Statistical analysis of core and E2 colocalization. Pearson's coefficient, the indicator of colocalization, was determined by regression of the pixel dot plots. Twenty-five individual images were analyzed for each group. (C) Proteinase K digestion protection assay. Huh7.5.1 cells were electroporated with full-length JFH1 RNA containing WT or M21T NS3 for 2 days. Cell lysates were treated with or without detergent (Triton X-100) followed by proteinase K digestion. Digested cell lysates were then analyzed by Western blotting to determine NS3 and core protein levels. (D) Statistical analysis of the percentage of core protected from the proteinase K digestion. Core signals were quantified by ImageJ, and the percentages of protected core were calculated as the ratio of core in the digested group and the undigested control. Error bars indicate standard deviations calculated from 3 independent experiments.